Alphabet Q2 Results – Stock up on beat

Current Price: $1,252 Price Target: $1,350

Position Size: 4.7% TTM Performance: -2%

Alphabet reported earnings, beating on the top line and EPS. Currency neutral net revenue accelerated to +24% YoY vs. +19% in 1Q. Revenue beat and acceleration was a relief after missing on the top line last quarter on a deceleration that wasn’t sufficiently explained. Additionally, some cost pressures moderated – TAC as a percent of revenue decreased and capex growth decelerated. Cloud was one of the top contributors of growth and, after over a year of no specific detail on cloud, they indicated it’s at an $8B run rate. They also announced a new $25B stock repurchase plan.

Key takeaways:

· Top growth drivers were mobile search, YouTube and cloud.

· Operating margin of 23.6% beat estimates by ~100bps as operating expense growth slowed.

· The biggest operating expense increase, once again, was in R&D expenses, reflecting their focus on product innovation. Headcount is also key driver in opex increases.

· Cloud is now at an $8B run-rate. This is double the run rate revealed in Q1 last year. On Amazon’s call yesterday they indicated that AWS growth slowed to 37% from 50% (this was slower than expected growth). Microsoft’s Azure grew 68% in the quarter. This substantiates the idea that the cloud positioning of Google, along with MSFT, is improving.

· Google had a change in leadership in their cloud business this year and is looking to triple its cloud division sales force this year.

· They mentioned some major cloud customers including Lowe’s and Vodafone,

· YouTube: channels with >1M subs grew 75%. YouTube Music and YouTube Premium now available in over 60 countries, up from five markets at the start of 2018.

· They have long talked about hardware as a growth priority for them and gave some positive data points around the most recent Pixel phone launch in May. They also said to stay tuned for a new hardware launch coming in the Fall.

· Stadia, their streaming video game business will also launch in the Fall.

· While Amazon is poised to take share in online advertising, growth in AMZN’s emerging ad business again decelerated this quarter while Google saw accelerating growth.

· Waymo announced that it has entered into an exclusive partnership with Renault and Nissan to explore driverless mobility services for passengers and deliveries in France and Japan.

· Increasing buybacks: repurchased $3.6B of stock in 2Q vs. $3B in 1Q and announced a new $25B stock repurchase plan – there’s ~$7B remaining on previous authorization.

· ESG: announced a $1 billion investment in housing across the Bay Area to help address the chronic shortage of affordable housing. And earlier this week, they invested $50 million in Housing Trust Silicon Valley’s TECH Fund, which furthers the goal to help communities succeed over the long-term and expands access to housing for those who need it most.

Valuation:

· Operating cash flow was $12.6 billion with free cash flow of $6.5 billion.

· Reasonable valued, trading at >4% FCF yield on 2020.

· $108B in net cash, ~14% of their market cap.

$GOOGL.US

[tag GOOGL]

Sarah Kanwal

Equity Analyst, Director

Direct: 617.226.0022

Fax: 617.523.8118

Crestwood Advisors

One Liberty Square, Suite 500

Boston, MA 02109

www.crestwoodadvisors.com

Alphabet Q2 Results – Stock up on earnings beat

Alphabet is up >6% after-market – they reported earnings, beating on top line and EPS. Alphabet 2Q Rev. Ex-TAC $31.71B vs street $30.84B. EPS was $14.21 vs street $11.49. Positives included strong growth in “other” revenue which includes cloud and some moderation in capex spending which has been very elevated. More details to come.

$GOOGL.US

[tag GOOGL]

Sarah Kanwal

Equity Analyst, Director

Direct: 617.226.0022

Fax: 617.523.8118

Crestwood Advisors

One Liberty Square, Suite 500

Boston, MA 02109
www.crestwoodadvisors.com

Hilton 2Q19 Results

Share Price: $96 Target Price: $105

Position Size: 2.9% 1 Yr. Return: 18%

Hilton beat on revenue ($2.5B vs $2.4B) and EPS ($1.06 vs $1.02, +23%). Full year RevPAR guidance lowered as global macro trends weaken. Despite that, EPS guidance was increased, demonstrating the strength of their high incremental margin, fee driven business. On 1.4% RevPAR growth in 1Q, they grew EBITDA 11% – again ahead of the high end of guidance and consensus. While RevPAR is weakening, they are outpacing peers and their model is a lot less dependent on macro driven RevPAR growth and much more pipeline dependent. Their pipeline growth is not slowing and has some countercyclical aspects. They reiterated their plan to return $1.3-$1.8B in capital to shareholders for the year, equating to 5-7% of current market cap. They’ve already returned almost $800m YTD.

Key takeaways:

· RevPAR of 1.4% (this was the mid-point of guidance) outperformed the industry for the 6th consecutive quarter. RevPAR increase driven by increases in both ADR and occupancy.

· Full year RevPAR guidance lowered to 1-2% from 1-3% as their broad macro outlook has weakened.

· Solid net unit growth continue to drive strong performance. Net unit growth of 7% is running ahead of originally targeted 6.5% for the year. Current pipeline of 373k rooms represents 40% unit growth. With expected annual growth of about 6%, this is several years’ worth of growth with about half of it already under construction. >50% of pipeline is outside of the US. And more than 90% of their deals do not require any capital from them.

· Continued improvement in their market leading RevPAR index – RevPAR index is RevPAR premium/discount relative to peers adjusted for chain scale. They are the market leaders – this is helpful because it’s what leads to pipeline growth (hotel operators want to associate w/ the brand that yields the best rates and occupancy) and is helpful in a macro downturn because it’s even more crucial for a developer to be associated with a market leading brand to get financing. i.e. they would likely take more pipeline share if lending standards tighten. The other countercyclical aspect of their pipeline growth is conversions (an existing hotel changes their banner to Hilton).

· In a sensitivity analysis to a market downturn, mgmt. said they would expect flat to slightly positive growth in adjusted EBITDA and positive growth in free cash flow in an environment where RevPAR were to decline 5% to 6%. This is b/c Hilton is structurally different than it was last cycle – asset light means less operating leverage and less volatile earnings stream if RevPAR continues to weaken. Moreover, unit growth will aid EBITDA growth regardless of RevPAR trends.

· Tru is a fast growing new brand for them which management says has the opportunity to be much bigger than Hampton Inn. Hampton Inn is their largest brand with over 250K rooms.

· Their model is resilient because their pipeline is their growth driver.

· China is seeing weakness – their Chinese business is largely driven by Chinese domestic leisure travelers – these consumers are being negatively impacted by the trade war. Ongoing protests in Hong Kong are also having an impact.

· Loyalty members hit 94m from 89m last quarter and account for >60% of system-wide occupancy. Goal is to have 100m members by the end of the year.

· The stock is undervalued, trading at ~6.5% FCF yield on 2019.

Investment Thesis:

∙ Hotel operator and franchiser with geographic and chain scale diversity of 17 brands, 5,900 hotels and 939k rooms across 114 countries (Hilton, DoubleTree, Hampton Inn & Hilton Garden Inn ≈ 80% of portfolio).

∙ Network effect moat of leading hotel brand and global scale lead to room revenue premiums and lower distribution costs.

∙ Shift from hotel ownership to franchising results in resilient, asset-light, fee-based model.

∙ Record pipeline generating substantial returns on minimal capital will lead to increasing ROIC and a higher multiple.

∙ Unit growth and fee based model reduce cyclicality – Lower operating leverage vs ownership reduces earnings volatility and unit growth offsets potential room rate weakness.

∙ Generating significant cash which is returned to shareholders through dividends and buybacks.

$HLT.US

[tag HLT]

Sarah Kanwal

Equity Analyst, Director

Direct: 617.226.0022

Fax: 617.523.8118

Crestwood Advisors

One Liberty Square, Suite 500

Boston, MA 02109

www.crestwoodadvisors.com

Visa 3Q – Beat and slight FY EPS raise

Current Price: $181 Price Target: $185

Position Size: 4.3% TTM Performance: 29%

Visa continued to perform well in the third quarter with better than expected revenue and EPS. Net revenue was +11% vs street +8%. EPS was $1.37 vs consensus $1.32. Full year revenue guidance reiterated and EPS guidance raised on lower client incentives. Purchase volumes accelerated from last quarter but were slightly weaker than expected. Easter was blamed for weakness last quarter and benefited this quarter. Cross border, which accounts for about a quarter of gross revenue and is higher yield, also improved. Fluctuations in exchange rates leads to choppiness in this business. They reaffirmed full-year 2019 net revenue growth of "low double-digits" on nominal basis and slightly increased adjusted EPS growth to “mid-to-high-teens.” Management said volume growth through the first few weeks of Q4 remained solid.

Key Takeaways:

· They had 52 billion transactions (+10%) on their network driving >$2.2T in total volume, +9%, an acceleration from +8% last quarter. Credit was +7% and debit was +11%.

· US payments volume growth was ~9%.

· International payments volume growth in constant dollars was +2.2%. FX was ~670bps headwind.

· They saw decent growth across all geographies.

· Announced extension of their relationship with the largest issuer, JPM, through 2029.

· More emphasis on potential of Visa Direct – this capability supports long-term secular growth in non-traditional transactions (i.e. not consumer-to-business (C2B)). This enables direct, real-time, bank account to bank account transfers and is an important capability for them long-term that drives growth in B2B, B2C, P2P, G2C. This technology, which powers Venmo and enables new payment flows like an insurance reimbursement, massively increases their addressable market. Recently closed Earthport acquisition supports this, especially with cross border.

· Contactless payment will also be a growth driver – Many markets, including the US, are very underpenetrated. In more mature markets like Australia there’s 90% penetration. Contactless = wave your card over reader instead of swipe. It leads to higher penetration of small transactions where cash tends to be used.

· Total cards outstanding up 3% to 3.4B. One third credit, two thirds debit.

Valuation:

· Strong FCF continues to support buybacks.

· Trades at a ~3.5% FCF yield. Reasonable for a company w/ >50% FCF margins, high ROIC, and, absent a recession, should continue growing top and bottom line double digits.

Thesis:

· Visa is the number one credit and debit network worldwide – accounting for about half of all credit and roughly three fourths of all debit card transactions.

· We are still in the earlier innings of the digitization of electronic payments. This is a secular tailwind supporting Visa’s growth as 1.) Electronic payments continue to replace cash 2.) Commerce moves online 3.) Consumer spending grows globally

· Visa’s asset light “toll both” business model is characterized by recurring revenues, high incremental margins, low capital expenditures, and high free cash flow.

· Visa’s recent acquisition of Visa Europe should be a nice tailwind over the next few years as the European market is in the earlier stages of electronic payment adoption and Visa is well positioned to gain market share and improve margins in the region.

$V.US

[tag V]

Sarah Kanwal

Equity Analyst, Director

Direct: 617.226.0022

Fax: 617.523.8118

Crestwood Advisors

One Liberty Square, Suite 500

Boston, MA 02109

www.crestwoodadvisors.com

PLEASE NOTE!

We moved! Please note our new location above!

Lockheed Martin (LMT) 2Q19 earnings summary

Key takeaways:

Current Price: $352 Price Target: $388

Position Size: 3.85% 1-year Performance: +12%

Lockheed’s 2Q19 earnings results were once again good with revenue growth of 8% and EPS +23%, thanks to higher fighter jets and missiles sales. With its bookings trend still positive (1.22X book to bill in the quarter, a good indicator for future demand), the revenue growth continues to look sustainable for the rest of the year. Margins expanded 80bps. While the US Government decided to suspend the F-35 deliveries to Turkey, this only represents about 8 planes/year for a total of 100 planes (131 F-35 will be delivered this year, see graph below for out years schedule). There should be minimal supply chain disruptions on the F-35 production from the Turkish situation. Production costs continue to come down as volume goes up and LMT finds opportunities to improve the program’s profitability. Overall this was a solid quarter. A raise of its full year guidance confirms the strength of LMT’s portfolio.

Continue reading “Lockheed Martin (LMT) 2Q19 earnings summary”

SHW 2Q19 – strong performance despite unfavorable weather

Current Price: $488 Price Target: $540

Position Size: 3.2% TTM Performance: +8%

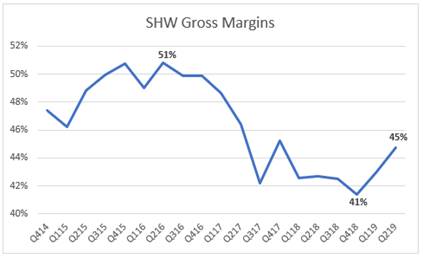
SHW missed slightly on revenue and beat on EPS. The stock is up on better margin outlook and impressive paint stores SSS performance. Margin improvement is expected with re-affirmed full year EPS guidance despite lowered sales guidance. Gross margins improved as recent pricing actions are gaining traction to offset raw material inflation. They expect continued GM improvement on stronger volumes and lower YoY raw materials. Biggest margin improvement in Consumer Brands Group and Performance Coatings, which drove the beat. They also reported strong +4.3% SSS in the Americas Group, an acceleration from last quarter. This was a relief given wet weather, lapping tough SSS, and their competitor, PPG, last week reporting flat SSS in N. America stores.

Key Takeaways:

· SHW is set to benefit from higher product prices, good volume growth, falling raw material costs and an improvement in housing.

· They continue to see softness in Asia and Europe.

· The Americas Group: 55% of sales, +5%

o SSS +4.3%

o Higher paint sales across all end markets in N. American stores and price increases.

o Segment margins increased 50bps.

o Opened 20 net new stores year to date.

o Professional painting contractor customers continue to report solid backlogs and project pipelines going forward.

· Consumer Brands Group: 16% of sales, +3.4%

o Growth due primarily to a new customer program launched in 2018 and price increases

o FX headwinds(-1.6%)

o Segment profit increased to 17.5% from 11.7% in 2Q last year due primarily to selling price increases, good cost control.

o Sales and profitability improved in N. America and Europe, but were partially offset by softer demand in Asia, Australia & New Zealand.

· Performance Coatings Group: 29% of sales, +3.8%

o Soft sales outside North America and unfavorable currency translation. FX headwinds(-2.7%)

o Segment profit increased to 11.4% from 10.5% in 2Q last year due primarily to selling price increases and good cost control.

o Revenue growth in Packaging and coil was more than offset by softness most notably in industrial wood division, which continues to be impacted by tariffs.

o Geographically, sales were up in Latin America and flat in N. America, offset by softness in Asia and Europe where sales decreased by low-double digit and mid-single digit percentages respectively.

· Guidance implies margin improvement:

o FY sales guidance lowered from +4-7% to +2-4%.

o Reaffirmed full year 2019 adjusted diluted net income per share guidance to be in the range of $20.40 to $21.40 vs $18.53 in 2018.

Valuation:

  • Expected free cash flow of ~$2B in 2019, trading at ~4.5% FCF yield.
  • Given growth prospects, steady FCF margins and high ROIC the stock is undervalued. They deserve a premium multiple based on large exposure to the N. American paint contractor market and no exposure to the cyclical sensitive auto OEM end market.
  • Balance sheet leverage from the Valspar acquisition continues to improve; they expect to get to under 3x by the end of the year.
  • Buybacks should accelerate as Sherwin returns to its historical capital allocation.

Thesis:

  • SHW is the largest supplier of architectural coatings in the US. Sherwin-Williams has the leading market share among professional painters, who value brand, quality, and store proximity far more than their consumer (do-it-yourself) counterparts.
  • Their acquisition of Valspar creates a more diversified product portfolio, greater geographic reach, and is expected to be accretive to margins and EPS. The combined company is a premier global paint and coatings provider.
  • SHW is a high-quality materials company leveraged to the U.S. housing market. Current macro and business factors are supportive of demand:
    • High/growing U.S. home equity values. Home equity supportive of renovations.
    • Improving household formation rates off trough levels (aging millennials).
    • Baby boomers increasingly preferring to hire professionals vs. DIY.
    • Solid job gains and low mortgage rates support homeownership.
    • Residential repainting makes up two thirds of paint volume. Homeowners view repainting as a low-cost, high-return way of increasing the value of their home, especially before putting it on the market.

$SHW.US

[tag SHW]

Sarah Kanwal

Equity Analyst, Director

Direct: 617.226.0022

Fax: 617.523.8118

Crestwood Advisors

One Liberty Square, Suite 500

Boston, MA 02109

www.crestwoodadvisors.com

Schwab Q2 Results – fears around stock are abating

Schwab reported strong Q2 earnings up 8% YoY with an organic asset growth rate of 5%. Investors have been concerned about Schwab’s deposit trends and potential for falling net interest margins due to Fed cutting rates. This quarter’s results seemed to ease some of those fears as trends around Schwab’s deposit base stabilized and outflows from deposits slowed.

Current Price: $ 42.7 Price Target: $53 (20x 2019E of $2.66)

Position Size: 2% Performance since initiation on 6/24/19: 9.1%

Q2 Highlights:

  • Core asset growth of 5% for Q2
    • Core net new asset growth of $37.2b for quarter and $88.9b YTD
    • Growth in Advisor services 9% YoY
  • Net interest margin – 2019 still a concern with falling rates
    • Deposits up 9.2% YoY, but down 8.5% QoQ due to cash sorting and seasonal tax payments
    • Schwab speculated that cash sorting issue is nearing completion as organic net flows to cash sweep turned positive in June
    • Net Interest Margin (NIM) was 2.40% up 10 bips YoY. Expects NIM to be 2.35%-2.40% for rest of year
    • Managing NIM risks in light of falling yields
      • Extending duration to top of range 2.5-2.75 years
      • Increasing fixed portion of portfolio to 70% from 60%
  • Asset Management and trading
    • Schwab Index Mutual Funds AUM $226b up 21% YoY
    • Schwab Index ETFs AUM $144b up 25% YoY
    • Trading revenue fell 3%, but is only 6% of revenue
  • Profitability – industry leader
    • ROE 19% and 46.1 pre-tax profit margin
    • Expenses up 7% while revenue was up 8%
  • Capital allocation
    • Repurchased 29.1m shares during quarter for $1.2b. $2.8b remains of authorized buyback. Buyback yield of 2.13%
    • Dividend yield of 1.4%
    • Shareholder yield of 3.5%

Schwab Thesis:

· Expect Schwab’s vertically integrated business model to drive AUM growth. Schwab has averaged 6% organic core net new asset growth as retail clients and advisors are attracted to Schwab’s low cost trading and custody services.

· Conservative, well-managed firm who is a leader in online trading and focused on leveraging platform.

· Schwab is on the cusp of generating excess capital which they plan to return to shareholders. Expect a 20%-30% payout ratio for dividends (1.7%) and management has approved a $4b share buyback which could amount to 4% to 5% of shares

John R. Ingram CFA

Chief Investment Officer

Partner

Direct: 617.226.0021

Fax: 617.523.8118

Crestwood Advisors

One Liberty Square

Suite 500

Boston, MA 02109

www.crestwoodadvisors.com

Crown Castle International ($CCI.US) Q2 2019:CCI Increases AFFO Outlook, Mixed Q2 Results

Crown Castle International Corp. (CCI) had mixed results during the quarter as they raised full year 2019 EBITDA and AFFO guidance but had relatively disappointing results with lower fiber demand and guidance of new small cells at 10,000 for the year, the lower end of expectations. The team discussed the lower fiber demand and reiterated that their concern is with small cells and that the incremental revenue that will come to the fiber business through the small cells is what they are focused on longer term. Discussing the construction of new small cells, the 10,000 number for 2019 is still within range of guidance, but the issues have come from delays in production rather than decreased demand. Because CCI is focused in the largest metro areas, there have been issues dealing with municipalities to get small cells built. CCI benefited from increased tower activity which has driven their increase in full year outlook. However, the long term plan has not changed. CCI is pursuing the expanding small-cell opportunity by focusing on top markets where there is greatest potential demand. The playbook is similar to towers in that they are providing fiber solutions and establishing common asset sites across their customer base. By increasing the number of users on an individual small cell site, they are incrementally increasing cash flow and, in turn, dividend yield for its investors.

Current Price: $126 TTM Return: 18%

Target Price: $130 Position Size: 2%

Continue reading “Crown Castle International ($CCI.US) Q2 2019:CCI Increases AFFO Outlook, Mixed Q2 Results”

JNJ 2Q19 earnings summary

Key Takeaways:

Current Price: $132 Price Target: $150

Position size: 2.58% 1-Year Performance: +6%

JNJ reported 2Q19 earnings results this morning. Total organic sales were up +3.7% and adjusted EPS up +22.9% ex-FX but including the sale of a business unit. The company is seeing good traction in its Consumer segment which seems to have turned around, growing +2.2%. Pharma was lower than in 1Q but still positive with a +4.4% organic sales growth. Medical Devices had a +3.2% organic sales growth, slightly lower than in 1Q. But the good print can’t erase the risks from the baby talc powder and opioid litigations, which remain a major overhang on the stock. JNJ is awaiting a verdict in the Oklahoma case, and a hearing on talc (July 22) will determine evidentiary standard on 85% of all talc outstanding cases. While JNJ as put money aside for its defense costs ($190M in 2Q19), it hasn’t provisioned any money in the event it loses its defense on talc and opioids, which is a risk for the company. The main risk that we do not see priced in the stock is if they did in fact provide drug compounds to Purdue (the market share leader) as many articles mentioned recently. Although JNJ sold the subsidiary that grew poppy seeds in 2016, a judge could draw the conclusion that JNJ’s market share is actually much higher than 10%, and JNJ should be held responsible to a greater level than currently talk about. We continue to monitor this situation as the risk is tangible. Continue reading “JNJ 2Q19 earnings summary”

Adding Schwab to Focus List

Schwab is a vertically integrated custodian that has shown strong organic asset growth, earning revenue on deposits, low-cost Schwab ETFs, trading and advisor network.

  • Strong AUM growth: Schwab has averaged 6% organic core net new asset growth as retail clients and advisors are attracted to Schwab’s low cost trading and custody services.
  • Vertically integrated: Schwab earns revenue from spread on deposits, low-cost ETFs, advisor fees and trading.
  • Defensive: Deposit revenue should increase when stock markets falls as investors tend to increase cash holdings during periods of stress.
  • Return of capital to shareholders: Schwab is on the cusp of increasing excess capital which they plan to return to shareholders. Over the next year, management expects cap-ex growth to slow to 3-5% from current 6-7% growth.  Expect a 20%-30% payout ratio for dividends (1.7%) and management has approved a $4b share buyback which could amount to 4% to 5% of shares.

Here is the presentation: Schwab Initiation

Thanks,

John