Selling Aramark, proceeds to TJX and HLT

Recommending we sell Aramark and add 100bps to TJX and 50bps to HLT.

Rationale for selling ARMK:

· The quality of this holding seems to be eroding – it’s one of the highest leverage ratios in our portfolio, thin margins, low ROIC, less confidence in execution, concerns of earnings quality and rising cost of capital for an acquisition driven company.

· Organic revenue growth targets 2-4%, which means almost no real growth for a company that is very exposed to rising input costs and needs to pass some through on pricing. Things like better labor productivity have aided in offsetting wage increases, but there is a limit to this.

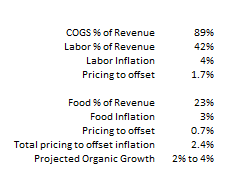
· Gross margins are about 11% and labor is their largest expense at 47% of COGS. Food is 27% of COGS. They expect 4% inflation in pricing next year and at least 3% in food. That means they need to take almost 2.5% in price to pass this through, which may be most or all of their organic growth next year. The low end of their organic growth target is only 2%. About ~30% of contracts are pass through, so they can contractually pass along inflation.

· FCF margins average 1.7% and valuation relies on FCF margins improving. However, new contract growth has a profitability lag because they require up-front costs that weigh on margins. This will be a drag on FCF.

o They capitalize up-front cash payments for renovations of client facilities. This hits the capex line and is in “other assets” on the balance sheet (net of accumulated amortization it’s around $1B). The up-front money they are spending on build-outs and renovations are key to them winning contracts – Aramark is essentially financing these assets (restaurant build-out and equipment) for their customers, but the “cost” to the customer is in Aramark’s margin. So Aramark gets a higher margin, a more bloated balance sheet (and lower ROIC) and the customer often owns the equipment at the end…which is usually a key test of whether it’s an operating lease or a capital lease. So part of their competitive advantage vs smaller players in this fragmented market is that they can lend use of their balance sheet.

o They have a spotty track record with accruals and expect net income to outpace FCF for the foreseeable future – their capex has been outpacing depreciation for the last few years – a good reason to look at their FCF margins instead…which are razor thin and requires lending out their balance sheet.

· Stock based comp is resulting in share dilution which they expect to be about 1% per year.

· The opportunity with this name and the thesis is about consolidating a fragmented industry…which does seem to be a big opportunity, but they haven’t been executing as well as hoped. While they benefit from scale, some of their technology initiatives they talked about in their investor day highlight a difficulty with their model: complexity. They try to manage wage inflation through improved labor scheduling because when they don’t, they have excess overtime and use of (higher cost) agency labor. They’ve acquired different technologies to help them manage this and help manage rising food costs. They do benefit from scale in purchasing power, but they also seem to suffer from it a little as well in the sense that this is an extraordinarily low margin business and they need to manage a gazillion employees and varied ingredient costs. The magic in restaurant chains can be that they keep stamping out the same box over and over again. Same menu, same labor model, consistent four wall margins. For Aramark, each “box” is more built to suit. Menus can be unique, labor requirements vary. In an environment of rising input costs it can make things very difficult.

$HLT.US

$ARMK.US

$TJX.US
[category Research Trade]
[tag AAPL]

[tag ARMK]

[tag HLT]

[tag TJX]

Sarah Kanwal

Equity Analyst, Director

Direct: 617.226.0022

Fax: 617.523.8118

Crestwood Advisors

One Liberty Square, Suite 500

Boston, MA 02109

www.crestwoodadvisors.com

SSGA SPDR Chart Pack

Good Morning,

Attached the most updated SSGA Chart Pack. There is a lot of good information in here, but below are a couple of slides I found interesting.

Flow Trends – while investors tended to flow into “safer” fixed income investments, this did not mean money was steering away from U.S. equities

U.S. Factor Trends – not surprisingly, there has been a positive shift toward low volatility and higher income sectors

Inflation – core inflation and expectations have moderated but labor costs rose to highest level since 2009

[Market Themes]

Peter Malone, CFA

Research Analyst

Direct: 617.226.0030

Fax: 617.523.8118

Crestwood Advisors

One Liberty Square

Suite 500

Boston, MA 02109

www.crestwoodadvisors.com

SPDR Chart Pack.pdf

Selling CTSH, proceeds to AAPL and IVV

We are selling Cognizant and adding 75bps to Apple and 175 bps to IVV.

Rationale for selling Cognizant:

· Labor arbitrage model of offshore outsourcing is becoming less attractive.

o Offshore wages are rising, narrowing the wage gap.

o While digital is driving growth, it only accounts for 29% of revenues. Growing at over 20%, this accounts for basically all their organic growth. Other 70%, legacy business has challenges and some negative impact from digital trends.

o The cloud is leading to lower labor intensity in some of CTSH’s key areas. This is also leading to less attractive contract terms and a loss of pricing power.

o Much of their India labor base (70% of their labor force) needs to be re-skilled – shortage of relevant skills is driving attrition and wages, which means CTSH is paying to train a labor force they are having a hard time keeping.

o Attrition and data security concerns (especially in data sensitive industries) is driving some insourcing, where companies hire their own teams offshore.

o Barriers to entry are eroding – customers are increasingly using smaller competitors with niche technology expertise.

Rationale for adding to Apple:

· Attractive valuation underpinned by high loyalty installed base and recurring revenue of services.

o A conservative DCF with low-single digit top line growth and slightly eroding FCF margins gives a >$200 PT. Current price is $168.

o As an alternate sum-of-the-parts view:

§ Subscription model companies trade at around an average multiple of 8x EV/annual recurring revenue (ARR). The multiple varies depending on growth.

§ 8X Apple’s very high-growth Services business ($40B annual run rate) contributes $320B in enterprise value.

§ Apples total EV is $677B (mkt cap is ~$800 less about $123B in cash). That means the rest of the business underpins the remaining $357B.

§ An LTV analysis of Apple’s high-loyalty installed base of iPhones already supports most of their valuation. LTV analysis is basically the net present value of a subscriber.

§ LTV can vary a lot depending on assumptions, so I use this as more of a scenario analysis: Apple has a 1.4B installed base of devices. Assuming an average of 1.5 devices per user and 90% iPhone penetration, that gives an installed base of about 840m (estimates vary, but this is slightly conservative). ASP’s are about $800, which can loosely be translated to an ARPU of about $215 using a 3.5-4 yr replacement cycle (again conservative). Further assuming a mid-30% contribution margin (or around $75/sub), no attrition, no growth, and an 8% discount rate this can be viewed as a perpetuity. These assumptions basically support Apple’s entire enterprise value. No attrition is the only non-conservative assumption. They actually don’t need to maintain ASP’s to make this math work either, they just need to maintain the recurring $75/head.

§ So, clearly, backing into an LTV based on a $357B enterprise value bakes in some bearish assumptions for what is the world’s most valuable consumer franchise. Moreover, this assigns no value to sales of iPads, Macs, Apple Watch etc.

§ While smartphones are maturing, Apple has a record of successfully transitioning from one product to the next…Mac to iPod to iPhone. They have done this with the assistance of multiple bolt-on acquisitions and have a lot of cash to do the same with Services. They also have had massive success without being first to the game…Blackberry, for example, led in smartphones before them. There are massive opportunities with Apple Music, Apple Pay, potential print & video subscription model, health wearables, CarPlay etc.

§ Including cash on the balance sheet and annual FCF production, they have >$300B in cash to deploy over the next 3 years to be net cash neutral (which is a stated goal). That’s over a third of their market cap.

Sarah Kanwal

Equity Analyst, Director

Direct: 617.226.0022

Fax: 617.523.8118

Crestwood Advisors

One Liberty Square, Suite 500

Boston, MA 02109
www.crestwoodadvisors.com

Bloomberg Markets – Abby Johnson & Kathy Murphy

Below is a link to an article that is in the most recent Bloomberg Markets magazine. Bloomberg gets a relatively rare interview with Abby Johnson and Kathy Murphy of Fidelity where they discuss fees, gender diversity, dealing with millennials, and more. Definitely worth a read.

https://www.bloomberg.com/news/features/2018-11-17/fidelity-s-abby-johnson-opens-up-about-crypto-and-index-funds

[Market Themes]

Peter Malone, CFA

Research Analyst

Direct: 617.226.0030

Fax: 617.523.8118

Crestwood Advisors

One Liberty Square

Suite 500

Boston, MA 02109

www.crestwoodadvisors.com

SSGA 2019 ETF Market Outlook

Good Afternoon,

Attached is a piece by Michael Arone at SSGA. There is a fair bit of marketing within the document pushing SSGA funds, but Michael provides his thoughts of cautious optimism heading into 2019. Broadly, SSGA has 3 suggestions for investment themes:

1.) Target quality over quantity of growth

2.) Get Defensive in bonds

3.) Focus on fiscal policy beneficiaries

We continue to buy into the first two themes and have enough international exposure to take advantage of the third theme as the most significant domestic consumption shifts from fiscal policy actions will likely occur abroad.

Thank You,

Pete

Peter Malone, CFA

Research Analyst

Direct: 617.226.0030

Fax: 617.523.8118

Crestwood Advisors

One Liberty Square

Suite 500

Boston, MA 02109

www.crestwoodadvisors.com

Navigating A Downhill Climb – 2019 ETF Market Outlook.pdf

By the Numbers – Family Wealth and Investing at a Young Age

Good Afternoon,

Attached is the most updated By the Numbers piece from MFS. The two statistics I highlighted today focus on the transfer of wealth to family heirs and the need to get individuals to start saving for retirement.

“37% of US households (45 million out of 121 million total households) will transfer assets estimated to be worth $68 trillion to family heirs and charities over the next 25 years. The $68 trillion represents 64% of the nation’s total household net worth of $107 trillion” (source: CerulliAssociates)

“A November 2018 survey of 1,161 employed adults determined that the average age at which this group began saving for retirement was 31 years old. The most common reason given for not starting sooner was “not making enough money”” (source: Nationwide Retirement)

The first point goes to show just how much money changes hands from one generation to the next and emphasizes that gaining trust in family heirs from early can be extremely beneficial longer term.

The first point dovetails into the second as the 31 year old individuals need help with wealth management prior to gaining their own nest eggs. The opportunity to gain the trust of these individuals could start before they have any of their own assets to invest.

Thank You,

Pete

Peter Malone, CFA

Research Analyst

Direct: 617.226.0030

Fax: 617.523.8118

Crestwood Advisors

One Liberty Square

Suite 500

Boston, MA 02109

www.crestwoodadvisors.com

BTN121018.pdf

REIT Increase Follow Up #researchtrades

Thanks Pete

Alyson L. Nickse, CFP®, CDFA®

Partner

Direct: 617.226.0024

Fax: 617.523.8118

Crestwood Advisors

One Liberty Square

Suite 500

Boston, MA 02109

www.crestwoodadvisors.com

From: Peter Malone
Sent: Tuesday, December 11, 2018 10:51 AM
To: CrestwoodAdvisors <crestwoodadvisors@crestwoodadvisors.com>
Cc: ” <>
Subject: REIT Increase Follow Up #researchtrades

As a follow up to this morning’s meeting, I have attached the presentation for internal use only. Additionally, I have included two write ups from Cohen and Steers that are helpful in shaping the argument for REITs and why it make sense to invest now.

Also, below is a snapshot of the sector allocation relative to a diversified U.S. REIT index as well as a list of the top ten holdings in the fund.

Peter Malone, CFA

Research Analyst

Direct: 617.226.0030

Fax: 617.523.8118

Crestwood Advisors

One Liberty Square

Suite 500

Boston, MA 02109

www.crestwoodadvisors.com

REIT Increase Follow Up #researchtrades

As a follow up to this morning’s meeting, I have attached the presentation for internal use only. Additionally, I have included two write ups from Cohen and Steers that are helpful in shaping the argument for REITs and why it make sense to invest now.

Also, below is a snapshot of the sector allocation relative to a diversified U.S. REIT index as well as a list of the top ten holdings in the fund.

Peter Malone, CFA

Research Analyst

Direct: 617.226.0030

Fax: 617.523.8118

Crestwood Advisors

One Liberty Square

Suite 500

Boston, MA 02109

www.crestwoodadvisors.com

Increase REIT Presentation.pptx 12.10.18.pptx

VP671_Riding_a_Wave_of_REIT_MA_US_VERSION.pdf

RET_Rising_Rents_Matter_More_to_REITs_Than_Rising_Rates.pdf

By the Numbers – Stock Winners vs. Losers and Long Term Estimates

Good Afternoon,

Attached is the most recent “By the Numbers” piece from MFS. The two stats I highlight today focus on a buy low/ sell high mentality to stock investing as well as an understanding of how difficult it is to predict spending decades into the future.

“An equal investment at the end of 2017 into the 10 stocks in the S&P 500 that gained at least +80% last year is down a collective 1.1% YTD as of Friday 11/30/18. An equal investment at the end of 2017 into the 10 stocks in the S&P 500 that lost at least 40% last year is up a collective +14.7% YTD as of Friday 11/30/18” (source: BTN Research)

“When President Franklin D. Roosevelt proposed the Social Security retirement program in 1935, FDR’s financial people projected that total Social Security expenditures would reach $1.3 billion in 1980 or 45 years into the future. The actual Social Security outlays in 1980 were $149 billion. Thus, the analysts’ 1935 estimate represented less than 1% of actual 1980 Social Security expenditures” (source: Social Security).

Regarding the first note, this would be a fairly difficult investing strategy, but it drives home the idea that the stocks that performed well last year are not always going to continue that trend. Conversely, holdings that have a poor year of performance can often provide a value opportunity.

The second point is not by any means a political point but rather indicates that accurately estimating outputs like national spending requirements decades into the future is nearly impossible. A variety of inputs come into play but population and demographic changes, and more importantly technological shifts play a major impact in any program of that nature.

Thank You,

Pete

Peter Malone, CFA

Research Analyst

Direct: 617.226.0030

Fax: 617.523.8118

Crestwood Advisors

One Liberty Square

Suite 500

Boston, MA 02109

www.crestwoodadvisors.com

btn12318.pdf

Black Knight Investor Day summary

BKI held an investor day last week. The key takeaways are that they maintained their long term growth expectations, but growth will now be more reliant on their ability to cross-sell products like data analytics. Additionally, they announced an investment in Dun & Bradstreet which has resulted in some weakness in the stock.

· LT outlook unchanged – Given higher penetration in 1st and 2nd lien loan servicing (70% of revenue), this suggests confidence in their cross-selling opportunities.

· Guidance is for 6-8% revenue growth, 50-100bps of margin expansion per year, and mid-teens EPS growth. They aim to keep leverage ratio at 3x.

· Growth opportunity:

o Revenue drivers are 1pt from loan growth, 2pts from rev/loan (price escalators and renewals), and 3-5pts on sales from new clients and from higher share of spending with existing clients (i.e. cross-selling).

o Most of their business is recurring revenue (93%) based on long term contracts. Servicing accounts for about 70% of their business and is not susceptible to exogenous factors like interest rates which can impact mortgage originations. It is based on the volume of mortgages outstanding. They have over 70% market share of the 1st lien market and, w/ their pipeline, about 30% of 2nd lien. This gives them an opportunity to sell their origination software (where their market share is quite low) and data analytics to existing customers.

· Dun & Bradstreet acquisition:

o $375m for <20% stake. They will draw down on their revolver to finance this.

o BKI CEO (Anthony Jabbour) will also be DNB CEO, but will be run as a separate company.

o DNB is a leading source of commercial data analytics and insights for businesses. Their data helps companies gauge risk management matters like who to extend credit to, will a customer pay on time, what credit limits they should set and how to avoid supply chain disruptions. That business is ~60% of revenue. Their other 40% of revenue is Sales & Marketing Solutions which provides things like lead generation, digital marketing solutions and market research.

o There is some skepticism around this acquisition for several reasons. For starters, it may occupy a lot of Anthony Jabbour’s time which could be detrimental to BKI. Also, there are no obvious synergies…nor did management specifically point to any. DNB’s data has different use cases, different end markets and they have struggled with organic growth. I think the commonality is really around two companies that have unique data sets which could be valuable as utilization of AI progresses because, as many are saying, “data is the new oil.”

o Management’s justification for the acquisition is that it diversifies them away from the mortgage market and they said that “the other compelling value for us in this space is we’ll have a front row seat to see how this industry unfolds over the coming years. And we think that’s an option that’s really worthwhile for us because of where we think this company can grow on a pure financial basis, but also where it can help us from our ability to really become further and further ahead of the pack in the data and analytics industry.” This is clearly lacking in any real detail, but it was as close to a justification as they gave. And I think it is consistent with my prior point about how they view their potential with AI.

· An example of their cross-sell opportunities:

o AIVA is their AI technology that can help clients automate what is still a very paper intensive origination process.

o Mortgage originations are expensive and getting more expensive partly because they are so labor intensive. They are also prone to errors. Why? A mortgage processor receives roughly 50 documents per loan, which equates to about 280 pages per loan. With over 7m originations projected for 2018, the mortgage industry is processing 350 million documents or 2 billion pages.

o The documents need to be verified, classified and entered into an origination system. AIVA can read, analyze and extract the data. It then creates queues of documents for a processor to scan and make corrections. In doing this, each new set of origination documents serves as training data, making AIVA “smarter” and more efficient.

o This obviously would speed up, lower the cost and increase the accuracy of the process. BKI says it reduces a 95 minute process to a 5 minute process. They are still in the early stages of selling this.

Sarah Kanwal

Equity Analyst, Director

Direct: 617.226.0022

Fax: 617.523.8118

Crestwood Advisors

One Liberty Square, Suite 500

Boston, MA 02109

www.crestwoodadvisors.com