Fun Fact on TJX

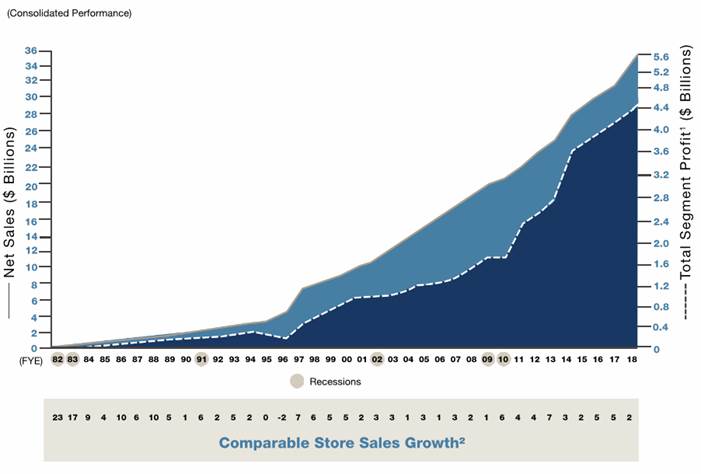
TJX has only had one year of negative comparable store sales growth in their 41 year history. Below is a chart going back to 1982 with comparable store sales at the very bottom – the only year it was negative is 1996. So, despite the severity of the last recession, they saw growth. Comparable store sales is also referred to as same store sales (SSS) – it measures year over year sales growth of stores open at least 12 months, so it excludes the impact of store openings or closures. Some companies include e-commerce sales in this measure – TJX does not.

[tag TJX]

Sarah Kanwal

Equity Analyst, Director

Direct: 617.226.0022

Fax: 617.523.8118

Crestwood Advisors

One Liberty Square, Suite 500

Boston, MA 02109

www.crestwoodadvisors.com

Medtronics (MDT) 2Q FY19: continuation of 1Q FY19 growth trend

Current Price: $92.8 Price Target: $100

Position Size: 3.11% TTM Performance: +14.5%

Key Takeaways:

Medtronic released their 2Q FY19 results this morning. MDT had an impressive +7.5% organic growth, thanks to +27.5% upside in Diabetes (mini pump demand), but also high growth in brain & pain therapies. EPS grew 13% y/y. Operating margins improved 80bps (ex-FX) thanks to company-wide savings. The company is raising its FY19 organic growth guidance by 50bps (+5.0-5.5%) based on the 1st half good results, as well as key pipeline products expected to drive growth in 2H19. But due to China tariffs, M&A dilution and FX impact, it is maintaining its EPS guidance for the year. Looking forward to FY 2020, Medtronic expects the launch of a surgical robot, helping sustain good top line growth. Overall this was another good quarter for the company, and the CEO sounded very upbeat on the pipeline potential for the company going forward, with a goal to innovate more but also disrupt the market.

Continue reading “Medtronics (MDT) 2Q FY19: continuation of 1Q FY19 growth trend”

By the Numbers – Returns after mid-year election & Aging population

Good Morning,

Attached is the most recent “By the Numbers” piece put together by MFS. The two facts that I highlight today discuss market returns following midterm elections and how many Baby Boomers are reaching retirement age.

“The S&P 500 stock index has gained an average of +15.3% in the 1-year following the last 17 midterm elections, i.e., change of the index’s value not counting reinvested dividends for the 1-year period following the midterm elections from 1950 through 2014. Each one of the 17 “1-year periods,” i.e., 100% of them, resulted in a stock market gain for the S&P 500” (source: BTN Research).

“An estimated 10,400 Americans will turn 65 years old each day next year (2019). This group represents the 9th year of 19 years of “Baby Boomers” turning age 65. An estimated 11,500 Americans will turn 65 years old each day in the year 2029” (source: Government Accountability Office).

The point about post mid-term election returns is not that we should expect this trend to continue in 2019. Instead, I would reiterate to clients that the results of the elections and possible “changing of the guard” in Washington is difficult to predict. More importantly, the forward looking return expectations are extremely difficult to predict and are generally driven by various factors outside of politics.

The fact about Baby Boomers emphasizes how many individuals are reaching retirement age on a daily basis. While this does not necessarily mean that everybody will be retiring at exactly age 65, it paints a picture of just how many individuals need to be prepared for life without recurring income.

Thanks,

Pete

Peter Malone, CFA

Research Analyst

Direct: 617.226.0030

Fax: 617.523.8118

Crestwood Advisors

One Liberty Square

Suite 500

Boston, MA 02109

www.crestwoodadvisors.com

btn111218.pdf

AAPL Update

Apple is down today because one of their suppliers, Lumentum (LITE), just cut guidance for next quarter raising concerns that iPhone sales next quarter will disappoint. Lumentum reported earnings results a couple weeks ago, but put out a press release today saying “we recently received a request from one of our largest Industrial and Consumer customers for laser diodes for 3D sensing to materially reduce shipments to them during our fiscal second quarter for previously placed orders that were originally scheduled for delivery during the quarter." Apple, which is 30% of their revenue, buys components related to face ID from them. LITE cut their revenue outlook by 17%.

Sarah Kanwal

Equity Analyst, Director

Direct: 617.226.0022

Fax: 617.523.8118

Crestwood Advisors

One Liberty Square, Suite 500

Boston, MA 02109

www.crestwoodadvisors.com

2018 Cap Gains Estimates

Good Afternoon,

Attached are the cap gains estimates for year end 2018. So far, the only funds that will be paying out cap gains are HILIX and BEXIX. Below shows the breakdown of short term and long term cap gain estimates based on a portfolio with $1 Million in assets in the growth model. The output assumes the highest tax bracket for both short and long term capital gains.

Ticker Name Capital Gains
Estimate Date3
Short-term
Capital
Gains as %
of NAV4
Long-term
Capital Gains as % of
NAV5
Total Capital
Gains as % of
NAV6
Tax Cost as % of NAV7 Position Size ($)8 Position Tax Cost ($)9 Sell by10
HILIX Hartford International Value I 19-Sep-18 0.89% 3.30% 4.19% 1.15% 55,000 631.69 14-Dec-18
BEXIX Baron Emerging Markets Institutional 30-Sep-18 0.00% 0.10% 0.10% 0.02% 20,000 4.76 27-Nov-18

Peter Malone, CFA

Research Analyst

Direct: 617.226.0030

Fax: 617.523.8118

Crestwood Advisors

One Liberty Square

Suite 500

Boston, MA 02109

www.crestwoodadvisors.com

Cap Gains Estimates 2018.xlsx

Cannabis Investment Piece

Good Morning – below (and attached) is a discussion about ways to invest in cannabis. Many people have already seen this but I have updated the total return charts. Broadly, we are not making any proactive recommendations on investing in this area as the asset class is very new, extremely speculative, and, for many clients can be controversial.

There is only one mutual fund investment currently available, and the product is extremely expensive and poorly diversified. There are also two different ETF options available to U.S. based investors that would be suitable investments for somebody looking to get exposure to the cannabis industry. I have also included the names of two ETFs that are available for Canadian investors. Another option would be to invest in a small basket of individual stocks, with an emphasis on the largest market cap names in the industry.

Continue reading “Cannabis Investment Piece”

MWTIX – Q3 2018 Commentary

MWTIX – Q3 2018 Commentary

MetWest Total Return Bond Fund performed in line with the Agg during the quarter. Slightly longer duration was a headwind during the period, while the strategy benefited from its allocation to non-agency MBS. Given that we are nearing the end of the credit cycle, the team is generally cautious and favors more quality investments including less cyclical credit and certain asset backed sectors.

Continue reading “MWTIX – Q3 2018 Commentary”

LMT 3Q18 earnings recap

Key takeaways:

Current Price: $309 Price Target: $388 NEW (old $374)

Position Size: 3.11% 1-year Performance: -3.6%

This week LMT released their 3Q18 earnings with sales +16% y/y (including an extra week vs. last year), operating margin +200bps y/y, and EPS +55%. Next quarter’s organic growth will not be as impressive, as the company is guiding to -1.4%, again due to calendar effect (+/- 1 week). Lockheed introduced its initial 2019 guidance. While the sales growth is above consensus numbers, the margins are slightly below, due to lower JV income in Space Systems. LMT typically increases its guidance throughout the year, and we expect them to do so again in 2019. For example, in October 2017, the sales growth guidance was 2%, and is now 6%, while margin was initially 10.3-10.5% and now 10.9%. Key positives items supportive of LMT growth are:

· The US Defense budget should continue to grow supported by continued security threats. Other countries see increase in spending as well: India, China and Japan. Europe’s defense budget is increasing as well, pressured by the US to spend more on military expenditures

· Accelerating F-35 production

· Ramp-up of Sikorsky’s CH-53K program (the aircraft’s name is “King Stallion”…who thought of that name? Rambo?): https://www.lockheedmartin.com/en-us/products/sikorsky-ch-53k-helicopter.html . The current pipeline is for 200 helicopters worth $25B

· Missiles: production capacity is being expanded as inventory level were shrinking and demand was well above production

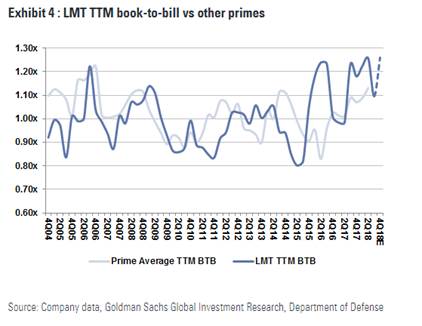
· Overall a healthy book-to-bill ratio (most likely to be at 1.25x by year end) – above 1 showing greater future demand than items currently shipped – is reassuring for 2019’s growth trajectory
· Strong balance sheet: net debt/EBITDA is down to 1.5x following the Sikorsky’s acquisition. This leaves room for LMT to do more deals

We updated our model and now see a $388 price target.

[more]

2018 guidance update:

Sales $53B (vs $51.6-53.1B prior guidance)

Operating margin $5.8B (vs. $5.575-5.725B prior)

EPS $17.50 (vs. $16.75-17.05 prior – $0.40 from better operational results, $0.20 from tax rate)

FCF should improve in 4Q as pension headwinds end (they are typically important for Defense companies)

Initial 2019 Guidance:

Sales growth 5-6% (current consensus is 5.2%)

Operating margin 10.5-10.8%, below consensus at 10.9%. The 10-40bps decline in margin is due to the loss of the JV income and mix (a growing number of new program starts next year)

$1B share repurchases

FCF will be affected by the new programs starts in 2019-2020, increasing the need for working capital.

LMT Thesis:

· Lockheed Martin is a primary beneficiary from the replacement cycle for aging military aircraft and ships

· Excellent management team focused on returning capital to shareholders

· Strong cash flow and financial position

[category earnings] [tag LMT] $LMT.US

Julie S. Praline

Director, Equity Analyst

Direct: 617.226.0025

Fax: 617.523.8118

Crestwood Advisors

One Liberty Square

Suite 500

Boston, MA 02109

www.crestwoodadvisors.com

By the Numbers – Market Perspective and Cost of Living

Good Afternoon,

Attached is the most recent “By the Numbers” piece put out by MFS. The stats I point out below put the size of the S&P 500 into perspective and show how cost of living after retirement can unfortunately increase quite drastically.

“When the S&P 500 fell 58 points on “Black Monday” (10/19/87), the tumble represented a fall of 20.5%. A 20.5% decline on last Friday’s (10/19/18) closing index value of 2768 would equate to a fall of 567 points. The largest drop for the index this year has been 113 points (source: BTN Research).”

“The national median cost in 2017 for an assisted living facility (private 1-bedroom accommodation) was $3,750 per month or $45,000 per year (source: Genworth).”

The idea that markets have “fallen X amount of points” is often an easy headline to catch the attention of the average investor. Obviously, it is human nature to hear that markets have fallen 58 points and have a negative reaction. It is our job to temper client reactions by noting that such a drawdown is less than 2% and, while not frequent, such occurrences happen every year and often multiple times.

Another difficult teaching moment for investors is the idea that, later in life, cost of living can increase. The cost of assisted living facilities continues to increase and insurance coverage (or help from children, relatives, charity, etc.) will vary from one individual to the next. This will emphasize the need to grow the nest egg over time by remaining invested in a broadly diversified portfolio built to fit their risk/return profile.

Thank You,

Pete

Peter Malone, CFA

Research Analyst

Direct: 617.226.0030

Fax: 617.523.8118

Crestwood Advisors

One Liberty Square

Suite 500

Boston, MA 02109

www.crestwoodadvisors.com

BTN 10-22-18.pdf