FW: Adding S&P Global to the Focus Equity portfolio #researchtrades

Recently we have added S&P Global (SPGI) to the Focus Equity portfolio. 


S&P Global is a highly profitable company with established “information” businesses that have deep moats in attractive industries.  Their history stretches back over 160 years.  Standard and Poor’s rating agency was created in 1941. 


Business lines


Ratings: (45% of revenue and 51% of operating income) is a key business for S&P Global.  Ratings industry is a duopoly between S&P and Moody’s who combined are over 90% of US ratings market.  Bond ratings are necessary workflow for issuers and buyers.  Revenue is based on new issuance (50%) and recurring fees for maintaining ratings.  Over past 3 years, segment has averaged 7% growth and over 65% operating margins – basically a big cash cow.


Indices:  (13% of revenue 18% of operating income) Own S&P 500 index fund and other indices.  They gain royalties from ETF and funds using their indices and have benefited from the growth in passive investing.  Over past 3 years, this segment has averaged 13% growth and over 70% operating margins – another highly profitable segment.


Market Intelligence: (28% of revenue 18% of operating income) Segment provides information and services to financial markets (Capital IQ) and businesses (supply chain analysis and credit risk solutions).  Segment has high recurring revenues and stands to gain from pending merger with IHS Markit.  Over past 3 years, segment has averaged 6% growth with over 30% operating margins.


Platts: (12% of revenue 12% of operating income) Industry leader in data and analysis for oil and gas markets.  They have been expanding into trade flow analytics, derivatives and new benchmarks.  Over past 3 years, segment has averaged 6% growth and over 50% operating margins despite falling energy prices.


Overview


Over the past 4 years, S&P Global has grown earnings 19% supported by rising margins and revenue.  They have little debt (minus cash) and a long term credit rating of ‘A3’ from Moody’s.  The firm has been focused on returning capital to shareholders.  Since 2015 they have returned $9.7b through share buybacks and dividends, reducing outstanding shares by 12%.  They have a stated goal of returning 75% of free cash flow to shareholders. 


S&P Global is a top ranked ESG firm – Sustainalytic rank 92, MSCI ranks A and RepRisk rating is zero (lower is better!).


In November S&P Global announced a merger with IHS Markit pending regulatory approval.   The all stock deal for $44b is expected to close in the second half of this year.  IHS has segments that focus on Financial Services, Transportation, Resources and technical engineering.  Like S&P Global they have lots of proprietary data and provide analysis to clients.  Known brands of IHS Markit owns are CARFAX, iBoxx indices, Ipreo, Thinkfolio, automotiveMastermind and shipping data dating back to 1764.  S&P Global believes that this acquisition increases their data breath and analytical capabilities allowing them to expand their addressable markets significantly.  S&P Global owns Kensho (artificial intelligence) and Panjiva (supply chain management) who will benefit from greater data pools and a broader client base.


Current valuation is attractive based on free cash flow valuation.  After the merger, S&P Global is expecting to increase margins through synergies by about 200 bips for each of the next two years. 


Starting weight S&P Global (SPGI) 2.5% in the Financial Sector

Funded from

APPL .75%

IVV .75%

BAC .50%

RMD .50%


Both Apple and Resmed have grown in weight due to strong performance.  Bank of America has rebounded sharply and further upside may be more of a grind.  We still consider these names as core holdings and are trimming on strength.


I look forward to discussing S&P Global next Tuesday at the RM/Research meeting.  Please see attached presentations and let me know if you have any questions.


Thanks,

John


[category Equity Earnings]

[tag SPGI]

$SPGI.US


John R. Ingram CFA

Chief Investment Officer

Partner


Direct: 617.226.0021

Fax: 617.523.8118


Crestwood Advisors

One Liberty Square

Suite 500

Boston, MA 02109

www.crestwoodadvisors.com


Bank of America Q4 2020 earnings

On 1/11, Bank of America (BAC) reported core Q4 EPS of $.60 with positives of strong balance sheet and negatives of weakish results in capital markets. We believe BAC is managing the pandemic recession well, building excess capital and has strong earnings power. 


Current Price: $31.5                         Price Target: $36

Position Size:   2.76%                       Trailing 12-month Performance: -5.7%


Q3 Highlights:

  • Strong credit quality with credit loses reverting back to pre-pandemic levels and BAC released reserves for loan losses
    • BAC actually released $858m reserves built up in anticipation for pandemic related losses, showing confidence in the recovery.
    • Net charge-offs (loan losses) are back to pre-pandemic levels

    • BAC has managed the pandemic well with strong credit performance.
  • Largest deposit base in country with $885b in consumer deposits
      • Deposit growth has surged up over 23% yoy
      • Low cost source of funding.  BAC pay only 4 bips on deposits.


  • Net Interest income increased to $10.37b from $10.24b las quarter
    • Net interest margin leveled off at 1.71% which they believe is the bottom
    • Expect NIM to trend up as increased deposits are invested and balance sheet growth, though they noted reinvestment rates remain a headwind.
    • NIM will remain depressed until we see a sustained economic recovery.  At that point, banks will be among the industries most levered to benefit from the rebound.


  • Excess capital – BAC is a return of capital story
    • BAC has massive excess capital of $36B (13% of market cap) with a CET1 ratio of 11.9% which is 2.4% above required minimum
    • BAC has approved a $3.2b share buyback for this quarter 
    • Current dividend yield is 2.28% for shareholder yield close to 7%.
    • Fed’s stress test has consistently shown BAC losses to be lower than peers Strong capital ratios:
  • Attractive valuation
    • BAC has strong earnings power – generates over $5b a quarter in earnings
    • BAC continues to build capital as share buybacks and dividend increases are restricted. 


BAC Thesis:


  1. BAC has dramatically improved their Consumer Banking unit which has driven earning’s growth.  Loss metrics are best among peers.
  2. Despite current recession, BAC has strong balance sheet and earnings power
  1. Their stronger capital position should lead to increased dividends and buybacks


Please let me know if you have questions.

Thanks,

John


[category Equity Earnings]

[tag BAC]

$BAC.US


John R. Ingram CFA

Chief Investment Officer

Partner


Direct: 617.226.0021

Fax: 617.523.8118


Crestwood Advisors

One Liberty Square

Suite 500

Boston, MA 02109

www.crestwoodadvisors.com


Berkshire Hathaway Q3 results

On 11/7, Berkshire Hathaway reported Q3.  Operating earnings rose slightly to $6.7b from $6.3b in Q2.  As expected operating companies were hit by the economic slowdown.  Key takeaways are as follows:

  • Buffett increased share buybacks to $9b, which is more than he has ever bought, bringing the total buyback for the year to $16b.
  • Cash on books remained steady at $147B. 
  • Cash and investment portfolio represent 70% of the company’s value.
  • Sum of the parts valuation shows 20% upside


Current Price: $231                         Price Target: $280 (raised from $260)

Position Size: 2.7%                          TTM Performance: 5.2%


Segment highlights from the quarter:

  • Insurance pretax earnings were down sharply (-70%)
    • Geico reported a -27% drop in pretax earnings due to program to give consumers premium credit due to the pandemic
  • Railroads – pretax profits rose 18% rebounding from last quarter
  • Berkshire energy – pretax profits up strongly due as MidAmerican benefitted from wind energy and tax credits
  • Service and retail – Profits rebounded up 93%
  • Manufacturing – Profits rebounded up 60%

Stock portfolio highlights:

  • Increased Apple holdings.  Apple has grown to 45% of the portfolio
  • Latest filing show the follow changes:
    • Added Merck, Pfizer T-Mobile and AbbVie
    • Exits Costco
    • Continues to sell Wells Fargo


Valuation:  Berkshire is selling at a 20% discount to intrinsic value using sum of the parts.  Their cash of $146b represents $60 per share for B shares. 


Berkshire remains a core holding, is currently undervalued and is defensively positioned to take advantage of opportunities as they arise.


Please let me know if you have any questions.


Thanks,

John


($brk/b.us)


John R. Ingram CFA

Chief Investment Officer

Partner


Direct: 617.226.0021

Fax: 617.523.8118


Crestwood Advisors

One Liberty Square

Suite 500

Boston, MA 02109

www.crestwoodadvisors.com


Schwab Q3 results

On 10/29, Schwab hosted their fall update for Q3, a quarter which had earnings of $.51. beating estimate of $.47.  Key takeaways are:

  • Schwab reported solid core new asset growth of 5%. 
  • Completion of the TD Ameritrade acquisition 
    • AUM jumps to $6.0t. from $4.1t
    • Expect cost savings of $1.8b-$2.0b over 2-3 years which will increase margins over 10%
    • SCHW is already the 7th most profitable company in the finance sector (on TTM pretax margin) and the cost synergies could increase margins 10 percentage points!
  • Low interest rates remain a headwind with Net Interest Margin (NIM) falling to 1.34%. 
  • Rising deposits up 52% yoy have helped offset falling NIM. 
  • Valuation remains attractive.


Despite lower interest rates, we remain optimistic that SCHW will continue to grow AUM significantly this year, leveraging its platform to drive ESP growth. 


Current Price: $41.64                     Price Target: $48 (up from $38)

Position Size:   1.85%                       Performance since initiation on 6/24/19: 8.8%


Q2 Highlights:

  • Total client assets rose to $6.0T, with core new asset growth of 5%. 
    • Client assets 6% annualized organic growth
    • Brokerage accounts 21% annualized growth
    • Focus on growing digital platform with 64% digitally active households
  • Net interest margin
    • Net Interest Margin (NIM) was 1.34% falling from 1.53% in Q2, more than offsetting the growth in deposits as interest revenue fell 14%. 
    • NIM will increase slightly with AMTD acquisition
  • Advice and Funds
    • Schwab fee based advice solutions assets grew to $361.2b up 13% YoY.
    • Schwab assets in proprietary ETFs up 12% to $168.9b
    • Expanding into bank loans with $22.3b up 32%
  • Profitability – industry leader
    • ROE 12% and 39.1% pre-tax profit margin.  Expect margins to expand 10% points over the next 2-3 years due to cost savings and scale from the mergers
    • Current expenses are elevated due to mergers
  • Capital allocation
    • Schwab will look to issue a preferred stock issue as growth in balance sheet and acquisitions will require more capital.  Share buybacks are on hold.
    • Dividend yield of 1.70%
    • Valuation is attractive at 19x earnings.  Target price set at 22x.

Schwab Thesis:


  • Expect Schwab’s vertically integrated business model to drive AUM growth.  Schwab has averaged 6% organic core net new asset growth as retail clients and advisors are attracted to Schwab’s low cost trading and custody services.
  • Conservative, well-managed firm who is a leader in online trading and focused on leveraging platform. 
  • Schwab will experience material AUM growth with USAA and TD Ameritrade mergers.  Expect SCHW to reduce costs and leverage platform.


Please let me know if you have any questions.


Thanks,

John


$SCHW.US


Travelers Insurance Q3 results

On 10/20, Travelers reported a Q3 EPS of $3.12, beating estimates of $2.99.  Positives for the quarter were improving margins, core return on equity of 13.5% and continued strong pricing gains in business and personal insurance lines.  Paradoxically, COVID-19 has improved profitability due to fewer claims in auto.


Travelers is a high quality, disciplined underwriter of insurance that is focused on returning capital to shareholders through dividends and share buybacks. 


Current Price: $123.92                           Price Target: $135 (raised from $120)

Position Size:   1.66%                              TTM Performance: -2.58% (up 14% since 9/30)


Thesis Intact. Key takeaways from the quarter:


  1. Core business results were solid, beating estimates

·         Combined ratio improved 6.6 points to 94.9%, ex-cats it improved 2.6 points to 91.5%

·         Net premiums increased 3%

·         Strong pricing with renewal premiums up:

    • Business +6.3%
    • Bond & specialty +8.1%
    • Personal Insurance +8.2%
    • International +7.3%

·         The industry has faced several headwinds – higher cat losses, negative tort trends and falling yields.  As a result industry wide pricing has been strongest in 10 years.

·         Losses related to COVID-19 total $133m driven primarily by worker’s compensation.  These loses were more than offset by lower claims in auto.  Net impact of COVID-19 has been a positive 2% points to the combined ratio.


  1. Net Investment Income rose $38m due to strong returns in private equity investments.


  1. Strong financial position
    • Debt to capital ratio of 22.7%
    • Most of debt is long term – just issued a 30yr bond yielding 2.5%
    • 97.9% of fixed income portfolio is investment grade with average rating of AA
    • Strong rankings from rating agency relative to peers


  1. TRV yields 2.7%.
    • No share buyback due to pandemic. TRV has built roughly $800m in excess capital.
    • Prior to pandemic, TRV has long record of returning capital to shareholders – past 10 years shares outstanding have fallen 53%!
    • Management has a history of employing capital wisely! Instead of investing in mature business with spotty pricing, they are returning excess capital to shareholders


  1. Current valuation of 12.2 P/E is close to historical mean.  Price target represents 13x 2021’s estimated earnings.


The Thesis on TRV:

  • We expect TRV will be able to grow book value per share in the mid-single digits over the near-medium term, and generate ROE in the 10-14% range
  • Industry leader with disciplined underwriting and investment portfolio track record  
  • Consistent returns in the low to mid double digits
  • Responsible capital allocation and proven desire to act in the best interests of shareholders


Please let me know if you have any questions.


Thanks,

John


$TRV.us


Bank of America Q3 results – Strong credit, weak interest income

On 10/13, Bank of America (BAC) reported core Q3 EPS of $.48 with positives of sharp decrease in provisions for bad loans and negatives of weak net interest income growth.  We believe BAC is managing the pandemic recession well, has a strong balance sheet, is building excess capital and has strong earnings power. 


Current Price: $24.2                         Price Target: $30

Position Size:   2.26%                       Trailing 12-month Performance: -17.3%


Q3 Highlights:

  • Strong credit quality with loan provisions falling to $1.4b from $5.1b
    • Good news!  The loan loss provisions were below street expectations and close to the normal quarterly run rate.  Considering that these provisions are forward looking, it bodes well for the state of the economy and health of the banking system.
    • US banks remain healthy.  Reserve build for the Top 5 banks in the US dropped sharply close to the normal run rate of loan provisions:


    • These provisions are NOT Comparable to those taken during the Great Recession. From Q4 2007 to Q4 2011, the top five banks increased provisions by $318b! More than 6x the provisions taken since the coronavirus pandemic started.
    • BAC’s outlook for credit is positive.  Consumer spending by their customers in October is about 10% above levels from last year.  Consumer deferrals balances are down from $1.7b to $0.1b in September
  • Net Interest income decreased to $10.24b from $12.34b a year ago as interest rates fell
    • Net interest margin fell to 1.72% which they believe is the bottom
    • Expect NIM to trend up as increased deposits are invested and balance sheet growth, though they noted reinvestment rates remain a headwind.
    • NIM will remain depressed until we see a sustained economic recovery.  At that point, banks will be among the industries most levered to benefit from the rebound.


  • Strong balance sheet
    • Nonperforming loans are lowest among peers
    • Fed’s stress test has consistently shown BAC losses to be lower than peers
    • Strong capital ratios: CET1 ratio of 11.4% which is 1.9% above required minimum
  • Attractive valuation
    • BAC is selling at a discount to book value! at 0.86x Book value and 11.8x P/E
    • BAC has strong earnings power – generates over $5b a quarter in earnings
    • BAC continues to build capital as share buybacks and dividend increases are restricted.  They have $35b in excess capital which equates to 6% of shares outstanding.


BAC Thesis:


  1. BAC has dramatically improved their Consumer Banking unit which has driven earning’s growth.  Loss metrics are best among peers.
  2. Despite current recession, BAC has strong balance sheet and earnings power
  1. Their stronger capital position should lead to increased dividends and buybacks


Please let me know if you have questions.

Thanks,

John


[category Equity Earnings]

[tag BAC]

$BAC.US


Schwab Q2 results- Strong AUM growth, but falling NIM

On 7/21, Schwab hosted their summer update for Q2 earnings of $.48.  Schwab reported solid core new asset growth of 5% as AUM reach $4.1t. Low interest rates remain a headwind with Net Interest Margin (NIM) falling to 1.53%.  Rising deposits have helped offset falling NIM.  Valuation remains attractive.


Despite lower interest rates, we remain optimistic that SCHW will continue to grow AUM significantly this year, leveraging its platform to drive ESP growth. 


Current Price: $ 34.98                     Price Target: $38 (down from $43)

Position Size:   1.6%                         Performance since initiation on 6/24/19: -9.0%


Q2 Highlights:

·         Total client assets rose to $4.1T, with core new asset growth of 5%. 

o   Client assets are up 11% YoY

o   Brokerage accounts up 18% YoY

o   Core asset growth should remain healthy into 2020 with TD Ameritrade acquisition ($1.2t in AUM) which is expected to close second half of this year.  Combined with core new growth of ~6% shows the potential growth in earnings power for SCHW as they lever their platform.


  • Deposit growth of $24b up 8.6%
    • Schwab continues to increase deposits at a pace faster than AUM growth as market volatility causes clients to raise cash.
    • Investing $24b should increase revenue by $360, which represents a 15% increase in revenue, so these interest earning assets are significant.
  • Net interest margin
    • Net Interest Margin (NIM) was 1.53% falling sharply from 2.14% in Q1, more than offsetting the growth in deposits as interest revenue fell 14%. 
    • NIM bottomed in 2013 at low 1.50%, and SCHW indicated that the floor this time might be 1.40%, so NIM will fall a bit from here.  Hopefully we have already seen the sharpest declines and interest income starts to stabilize.
  • Advice and Funds
    • Schwab fee based advice solutions assets grew $263b up 2% YoY.
    • Schwab revenue from funds and ETFs rose $452m up 2%
    • Trading revenue fell 7%, but trading revenue has fallen to only 7% of income
  • Profitability – industry leader
    • ROE 12% and 40% pre-tax profit margin
    • Expenses up only 8%, of which 6% are due to mergers
  • Capital allocation
    • Schwab will look to issue a preferred stock issue as growth in balance sheet and acquisitions will require more capital.  Share buybacks are on hold.
    • Dividend yield of 2.07%
    • Valuation is attractive at 17x earnings.  Target price set at 20x.

Schwab Thesis:


·         Expect Schwab’s vertically integrated business model to drive AUM growth.  Schwab has averaged 6% organic core net new asset growth as retail clients and advisors are attracted to Schwab’s low cost trading and custody services.

·         Conservative, well-managed firm who is a leader in online trading and focused on leveraging platform. 

·         Schwab will experience material AUM growth with USAA and TD Ameritrade mergers.  Expect SCHW to reduce costs and leverage platform.


Please let me know if you have any questions.

Thanks,

John


$SCHW.US

[category earnings ]

[tag SCHW]


John R. Ingram CFA

Chief Investment Officer

Partner


Direct: 617.226.0021

Fax: 617.523.8118


Crestwood Advisors

One Liberty Square

Suite 500

Boston, MA 02109

www.crestwoodadvisors.com


Travelers (TRV) Q2 results

On 7/23, Travelers reported a Q2 EPS loss of $-.20, in-line with expectations.  Results were hit by catastrophe losses for storms and civil unrest.  Losses related to the pandemic continue to be small (-$50m) partially offset by lower auto incidents.  Positives for the quarter were improving underlying margin improvement and continued strong pricing gains.


Travelers is a high quality, disciplined underwriter of insurance that is focused on returning capital to shareholders through dividends and share buybacks. 


Current Price: $118.61                          Price Target: $120

Position Size:   1.56%                               TTM Performance: -18.3%


Thesis Intact. Key takeaways from the quarter:


  1. Despite cat losses, core business results were solid

·         Combined ratio ex-cats of  91.4% ahead of expected 96.3%

·         Net premiums declined -1%, again ahead of expectations and not bad given environment

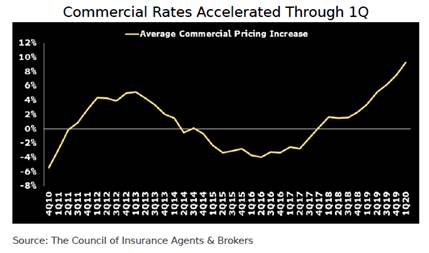
·         Strong pricing with renewal premiums up 2.5% to 7.8%.  The industry has faced several headwinds – higher cat losses, negative tort trends and falling yields.  As a result industry wide pricing has been strongest in 10 years:


  1. Net Investment Income fell $24m due to lower rates.  Non fixed-income investment results were down $-180m as these are reported with a lag of one quarter.
  2. Strong financial position
    • Debt to capital ratio of 23.2%
    • Most of debt is long term – just issued a 30yr bond yielding 2.5%
    • 97.9% of fixed income portfolio is investment grade with average rating of AA
    • Strong rankings from rating agency relative to peers


  1. TRV yields 2.87% – for Q2 2020 TRV did not buyback any share which is the first quarter in 10+ years.
    • First quarter in 10+ years that they did not buyback shares – Many financial companies have delayed share buybacks given optics of current environment
    • Over past 10 year shares outstanding have fallen 53%!
    • Management has a long history of employing capital wisely! Instead of investing in mature business with spotty pricing, they are returning excess capital to shareholders


5.       Current valuation of 12.3 P/E is close to historical mean.  Price target represents 12x 2021’s estimated earnings.


The Thesis on TRV:

  • We expect TRV will be able to grow book value per share in the mid-single digits over the near-medium term, and generate ROE in the 10-14% range
  • Industry leader with disciplined underwriting and investment portfolio track record  
  • Consistent returns in the low to mid double digits
  • Responsible capital allocation and proven desire to act in the best interests of shareholders


Please let me know if you have any questions.

Thanks,

John


$TRV.US

[category earnings ]

[tag TRV]


John R. Ingram CFA

Chief Investment Officer

Partner


Direct: 617.226.0021

Fax: 617.523.8118


Crestwood Advisors

One Liberty Square

Suite 500

Boston, MA 02109
www.crestwoodadvisors.com


Bank of America Q2 earnings

Bank of America (BAC) reported Q2 EPS of $.37 was ahead of estimates, but earnings were down 50% year over year.  Earnings were dented by a $5.1b provision for loan losses.  Interested income fell due to lower interest rates.  We believe BAC is managing the pandemic recession well, has a strong balance sheet and earnings power remains intact. 


Call highlights: “Baseline projection now extend the length of the recession environment into 2022, deep into 2022” Brian Moynihan CEO


Current Price: $ 23.9                        Price Target: $30 (decreased from $39)

Position Size:   2.3%                         Trailing 12-month Performance: -15.9%


Q2 Highlights:

  • $5.1 Provision for loan losses
    • This quarter is the second quarter since a new accounting rule for reserves was implemented which allows banks to estimate future losses and build reserves based on an estimate.  Reserve builds today are forward looking and hence much higher than those in 2009 due to the accounting change.
    • Increased provision to $21b doubled from end of year.  Reserves are 2% of total loans.
    • Not a normal recession: Due to massive government support, losses are not as high as 11% unemployment rate would indicate.  Additional government support for wages is important for all banks.
  • Net Interest income decreased from $3.8b to $3.5b
    • Lead by consumer, deposits increased 8% most of which was invested at the Fed at lower rates
    • Net interest margin fell to 1.87%
  • Strong balance sheet
    • Nonperforming loans are lowest among peers
    • Fed’s stress test has consistently shown BAC losses to be lower than peers
    • Strong capital ratios: CET1 ratio of 11.4% which is 1.9% above required minimum
  • BAC is selling at a discount to book value! at 0.9x Book value and 12.8x P/E
  • Though not mentioned on the call or in their presentation, BAC repurchased 1% of their outstanding shares for $5b last quarter.  Dividend yield is 3.0%.  Total shareholder yield is ~10%! 


BAC Thesis:


·         BAC has dramatically improved their Consumer Banking unit which has driven earning’s growth.  Loss metrics are best among peers.

·         Despite current recession, BAC has strong balance sheet and earnings power

·         Their stronger capital position should lead to increased dividends and buybacks


Please let me know if you have questions.

Thanks,

John


[category Equity Earnings]

[tag BAC]

$BAC.US


John R. Ingram CFA

Chief Investment Officer

Partner


Direct: 617.226.0021

Fax: 617.523.8118


Crestwood Advisors

One Liberty Square

Suite 500

Boston, MA 02109

www.crestwoodadvisors.com