Turkey’s currency collapse and market implications

As you probably know Turkey’s currency, the Lira, has fallen over 70% in value relative to the US Dollar over the past year. The currency declined steadily over the past year and the pace accelerated this month as there has been a rush to get capital out of Turkey.

How did Turkey get here?

A main part of Turkey’s vulnerability is due to rapid growth in US dollar borrowing. Years of near-zero interest rates in US has spurred lending in Dollars overseas. Below is a chart from St. Louis Fed that shows since 2003, lending in Dollars to non-bank emerging market companies has grown from $1 trillion to $3 trillion in 2017 (blue line).

Companies borrowed in Dollars, because at the time funding was cheap and plentiful. Emerging market debt funds were eager to buy EM corporate bonds which comprised a majority of the loan growth. US investors were happy for higher interest rates and borrowers enjoyed the inexpensive financing. Both parties underestimated or ignored the risk of having Dollar exposure. Problem with these loans is that the company earns money in their local currency to pay interest and principal on the loans in Dollars. As the local currency falls against the Dollar, the interest payment increases. In Turkey, interest payments (unhedged) have increased 70% YTD due to the fall in the Lira. Yikes!

Turkey has other vulnerabilities – trade deficit, high inflation and budget deficit. The twin deficits mean that Turkey relies heavily on foreign capital to function, while inflation erodes the value currency. However, it seems the main issue is Dollar debt and the drop in the value of the Lira.

How serious is this for Turkey’s economy?

This plunge in Turkey’s currency is very serious. Turkey will most likely face a recession as the sudden and steep drop in currency will lead to a slowdown in growth. Their highly levered banking sector (loan to deposit ratio of 145% versus US banking system’s ratio of 70%) will need capital to continue making loans to support economic growth. Turkey runs a current account deficit, so trade is not a source of external currencies, but a drain. The steep drop in the value of the Lira shows that market confidence in Turkey is gone. Further lack of confidence in the regime of Recep Erdogan, a dictator with a history of human rights abuse, will be a huge hurtle in obtaining loans from developed countries. Without support it is likely that Turkey faces a severe recession, defaults and a tough decade. The outlook is not good – think Venezuela.

Will Turkey’s problems spread?

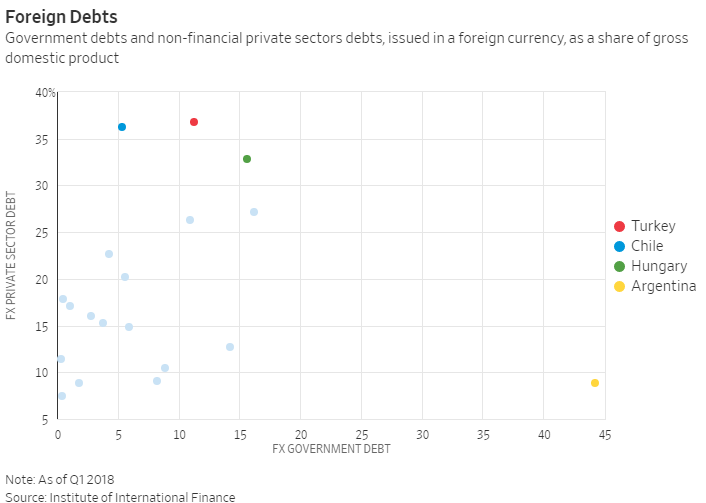
Probably. Higher interest rates and stronger US Dollar are a strong headwind for emerging markets especially where there has been heavy Dollar borrowing. In June, Argentina received a $50b bailout from the IMF to help maintain their currency value, so Turkey’s difficulties were not first. Chile, Hungary, Egypt, Brazil and Argentina all have sizable borrowings in foreign currencies. Some of these countries, Argentina, Brazil and Turkey, run trade deficits which can also pressure currency valuations.

Turkey is not alone in the economic characteristics that precipitated this collapse of confidence, but it is not a given that the fear will spread. Certainly markets will keep a watchful eye on similar markets. Please see WSJ article: https://www.wsj.com/articles/turkeys-economic-red-flags-stand-out-among-emerging-markets-1534336200?mod=searchresults&page=1&pos=7

What about Crestwood’s clients?

Crestwood has avoided EM debt funds despite very tempting yields. We believe that bond investors do not get properly paid for currency risk. Also, froth in the EM dollar lending boom was clear. Recall the 100 year Argentinian bond issue? $2.75 billion sold last June despite Argentina’s history of defaulting seven times on external debt. They made it 12 months before needing an IMF bailout. Currently, the bonds are selling $89 on $100 par – only 99 years to go! Or the $500b Tajikistan bond issue to finish a massive dam started by the Soviets in 1970’s. The par value of the bonds represents 15% of countries annual GDP and raises Tajikistan’s external debt level to 50% of GDP. Those too are selling at $89 per bond.

As we have mentioned, we believe the role of bonds in the Growth model is to provide diversification to the equity holdings which provide 90% of the risk. EM Debt does not provide much diversification especially in risk-off periods.

In Crestwood’s Growth model, our exposure to emerging market stocks is modest, standing at 4%. We continue to be overweight US equities (75% of equities) versus international equities (25% of equities).

Please let me know if you have any questions or comments.

Thanks,

John

John R. Ingram CFA

Managing Director

Asset Allocation and Research

Direct: 617.226.0021

Fax: 617.523.8118

Crestwood Advisors

One Liberty Square

Suite 500

Boston, MA 02109

www.crestwoodadvisors.com

Berkshire Hathaway (BRK/B) Q2 2018 results

On Friday, Berkshire Hathaway (BRK) reported Q2 earning of $2.79, handily beating estimates of $2.24. Results were strong in most businesses highlighted by results from GEICO, Reinsurance and Burlington Northern. Book value grew by 19% y/y. BRK holds over $111b of excess cash and is expected to increase share repurchases. BRK’s collection of high quality businesses continue to generate significant cash flow. Price target raised to $225.

Current Price: $209 Price Target: $225 (raised from $200)

Position Size: 3.3% TTM Performance: 17%

Thesis Intact. Key takeaways from the quarter:

Continue reading “Berkshire Hathaway (BRK/B) Q2 2018 results”

Bank of America (BAC) Q2 2018 results

Bank of America (BAC) reported core Q2 EPS of $.67 above market expectations of $.65 due to solid expense control, better card income and capital market results. BAC continues to be levered to rising rates, improve the balance sheet and return capital to shareholders. BAC increased the dividend by 25% and plans to return $26b to shareholders via buybacks and dividends for a shareholder yield over 8%.

Current Price: $30.8 Price Target: $37 (Increased from $30 – 15x 2018E)

Position Size: 3.5% Trailing 12-month Performance: 25.5%

Q1 Highlights:

  • Solid results, despite weak revenue growth
    • Good control of noninterest expense -5% yoy
    • Strong digital footprint
      • Increased digital bank users to 35.7m from 30.8m a year ago
      • 76% of deposits are conducted digitally
    • Focused on returning capital to shareholders
  • Continued improvement in the balance sheet
    • Common equity tier 1 ratio 11.3% up from 7.8% in 2009 and above Fed’s target of 9.5% for BAC
    • ROE of 10.8% with a return on tangible book of 15.2%
    • Net charge offs 0.43%
  • Net Interest income was increased 5% YoY
    • Loan growth of 5% and deposit growth of 3%
    • 100 bps increase in yield curve will increase net interest income by $3.2b over the next year, driven by sensitivity to short-term rates
    • Strong growth in online banking with attractive offering for consumers – up 19% yoy.
  • Continued strong expense controls
    • Total headcount fell 1%
    • Efficiency ratio improve 100 bps to 59%
  • BAC is still attractively valued at 1.1x Book value and 14.2x P/E
    • New target represents 1.5 times book value
    • Expect the stock to grind higher given our view of accelerating EPS over the next 12-18 months driven by:
      • BAC’s focus on balance sheet quality
      • Declining expenses
      • Positive leverage to rising rates
  • BAC is focused on returning capital to shareholders increasing the dividend 25% and a shareholder yield over 8%

BAC Thesis:

· BAC has transformed its business to a higher quality mix

· Recent results demonstrate an accelerating EPS growth and returns over the next 2 years

· BAC has become a return of capital story

($BAC.US)

John R. Ingram CFA

Managing Director

Asset Allocation and Research

Direct: 617.226.0021

Fax: 617.523.8118

Crestwood Advisors

50 Federal Street, Suite 810

Boston, MA 02110

www.crestwoodadvisors.com

Wells Fargo (WFC) Q2 2018 Results

Wells Fargo (WFC) reported core Q2 EPS of $1.11 versus street expectations of $1.12. Results were a bit messy and included several one-timers. Wells continues to make progress on improving relations with employees and customers as they look to put the various scandals behind them. Wells is becoming a return of capital story with over $25b in excess capital. Wells plans to increase dividends and double their already sizable share repurchase program – increasing shareholder yield to over 11%.

Current Price: $56.7 Price Target: $60 (increased from $56 15x 2018 earnings)

Position Size: 3.6% Trailing 12-month: 6.1%

Highlights:

  • Update on settlements, lawsuits and balance sheet restrictions
    • Expects the Federal Reserve to lift balance sheet restriction during first half of 2019
    • Accrued charges in Q2 2018 to refund customers for pricing of foreign exchange transactions and fee calculations for wealth management area
    • On 4/20/18 Wells reported a $1b settlement with OCC and CFPD relating to forced car insurance and mortgage fees.
    • Wells still needs to settle with DOJ over residential mortgage policies dating back to the financial crises. Estimates place the settlement at $2b, but Wells has already set aside reserves of $3.2b
    • Additional lawsuits exist for overdraft fees, foreign exchange, mortgage fees, improper account closing and other smaller suits. Wells is not out of the woods, yet.
    • Replaced former Chairman, John Stumpf with CEO, Tim Sloan, and CFO Elizabeth Duke, a former Fed member, as independent chairman.
    • Named 6 new independent directors
    • Plans to spend 2% of earning to philanthropy (up from 1.3%)
    • Recent moves to improve standing of employees
      • Increased base minimum hourly wage to $15.00 an increase of 11%
      • Increased 401k and profit sharing programs
      • Increased stock incentive compensation
    • Recent improvements to help customers
      • Overdraft rewind, zero-balance alerts, debit card on/off capability, and P2P payments
  • Wells is a return of capital story
    • Common Equity Tier 1 Ratio of 12.0% with a target of 10% – $25b in excess capital
    • ROE 10.6% (Return on tangible equity 12.6%)
    • Returned $4.0b to shareholders through dividends and share repurchases.
    • Increased dividend 10% from $.39 to $.43.
    • Increased share repurchases from $4b to over $8b which is shareholder yield of over 11%.
  • Excellent banking business
    • Strong balance sheet – Net charge offs and Nonperforming loans near historic lows.
    • Balance sheet restrictions has allowed trimming of lower quality loans – autos loans and pick-a-pay mortgage loans
    • Return on tangible equity 12.6%
    • Generates $5b per quarter in earnings
    • $1.27 trillion deposits with average cost of 40 bps
  • Noninterest revenue down -8% yoy – area affected most by changes to companies practices
    • Weak Mortgage banking with drop in margins for origination
    • Consumer fees (deposit service, card fees and other) were down in effort to please customers
    • Noninterest expenses were up 3% YoY mainly on higher salaries and benefits
    • Efficiency ratio improved to 64.9
  • Net interest income improved 1% yoy
    • Average total loans down 1% yoy
    • Consumer loans down $6.6b with largest reduction in auto loans
    • Rate paid on deposits has risen from 0.17% 1Q17 to .40% 2Q18
  • Valuation is fair on depressed earnings WFC now trades at 14.5x P/E. WFC is targeting $4.0b in cost savings over the next two years – an aggressive target.

WFC Thesis:

  • Best franchise in banking due to disciplined loan writing and quality mortgage underwriting
  • Large deposit base that provides low cost funding
  • Strong capital ratios put WFC in a good position to be opportunistic, invest for the long-term and return capital to shareholders
  • Fair valuation and potential for earnings rebound in 2018

($WFC.US)

John R. Ingram CFA

Managing Director

Asset Allocation and Research

Direct: 617.226.0021

Fax: 617.523.8118

Crestwood Advisors

One Liberty Square

Suite 500

Boston, MA 02109

www.crestwoodadvisors.com

Empirical Research’s take on trade

Empirical Research has provided some insight on potential tariff effects.  Key points:

1) Manufacturing matters more to the markets than to GDP.  40% of S&P 500 earnings versus 12% of GDP.

2) Most exports to China are agricultural products and commodities, which are not as costly to source elsewhere.

3) High-tech imports from China are roughly half of all imports.  A third of imports from China are consumer goods.

Portfolio Strategy – U.S. – China Trade War, Margins and Tax Havens, Restructurings – Jun 20 2018

Review of the size effect in investing (AQR)

Below is a link to an article on investing in small cap stocks.  The paper dispels the long held belief that small stocks outperform large cap stocks.  The paper revisits and corrects prior studies that led investors to champion small cap stocks.  These prior studies were distorted by pricing errors in the CRSP pricing database when a stock was delisted.

AQR – Size effect

The study concludes that the small cap effect is weak at best and mostly explained away by higher beta and the value effect.  I know several firms that drink the small-cap Kool-Aid.  Should a client show concern at Crestwood’s modest allocation to small caps, this paper will support the construction of our models.

Thanks,

John


Crestwood’s ESG initiative

On 5/8/18, Crestwood unveiled its ESG integration initiative.  For individual stocks, ESG ratings will help inform our evaluation of management.  To derive ESG rankings, we have combined the services of RepRisk (news-based) with Sustainalytics (disclosure-based).  We believe this process will help reduce risk, improve performance and help differentiate Crestwood’s investments.  Please see below presentation:

ESG presentation

Thanks to the Research Team for all their work!

John


Fairfax Q1 2018 results

Fairfax’s reported strong Q1 2018 operating earnings of $3.96 versus $3.11 last year. Book value grew a healthy 4.9% for the quarter boosted by strong investment results. Insurance results were solid with organic premium growth of 7.1% and a combined ratio of 96%.

Current Price: $ 549 Price Target: $580

Position Size: 1.6% TTM Performance: +23.4%

Thesis Intact. Key takeaways from the quarter:

  1. Insurance results
    1. 96% combined ratio with underwriting profit of $109m. All major insurance companies had combined ratios less than 100 (which means they made a profit). Favorable prior reserve development of $86m.
    2. Average annual reserve redundancy of 3.5% over past 7 years
    3. Insurance operations hold $22.7b in float ($819 per share)
    4. Incredibly well capitalized firm 23.8% debt (up from 18% due to Allied acquisition)/ capital and 8.0x interest coverage
  2. Investment portfolio
    1. Holding company continues to hold a 50% cash.

  1. Firm has broadened its equity holdings and reduced IBM position.

  1. Firm has a large position ($114b notional value) in CPI-linked derivative, which will protect the company from a Japan-like scenario as well as potential debt solvency concerns. However, this position has recently been a drag on investment returns.
  2. Looking to improve 5-year returns on investment portfolio of 2% to historical levels of 8% or better
  1. Valuation:
    1. Fairfax trades at a discount to other P&C stocks at 1.2x BV.
    2. Shareholder yield of over 5.7%. Over the past 6 months Fairfax bought back $543k worth of shares. If you annualize that level, the share buyback yield is 4.0% with a dividend yield of 1.7%

The Thesis on Fairfax:

  • Fairfax is a disciplined insurance underwriter with an excellent investment track record
  • Unmatched book value growth – 19.5% for past 32 years
  • Attractive valuation and well above average management team
  • Defensively positioned balanced sheet

$FRFHF.US

John R. Ingram CFA

Managing Director

Asset Allocation and Research

Direct: 617.226.0021

Fax: 617.523.8118

Crestwood Advisors

One Liberty Square

Suite 500

Boston, MA 02109
www.crestwoodadvisors.com