Research Blog – INTERNAL USE ONLY

SHW 3Q19 Update

Current Price: $564 Price Target: Increasing to $660 from $540

Position Size: 3.7% TTM Performance: +38%

SHW beat on revenue and EPS and increased the midpoint of guidance (implies +14% YoY EPS growth). The America’s group again had impressive paint stores SSS performance of +8%. Gross margins continue to improve as recent pricing actions are gaining traction to offset raw material inflation. Performance in the quarter was driven by continued strength in North American architectural paint markets, which offset choppiness in some industrial end markets. Management talked positively about housing market strength – despite headline miss reported today in existing home sales which were down sequentially, but still up YoY.

Key Takeaways:

· SHW is benefitting from higher product prices, good volume growth, falling raw material costs and an improvement in housing.

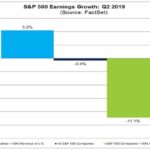
· Margins increased in all 3 segments.

· They continue to see some softness internationally and strength in the US.

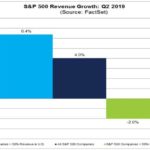
· The Americas Group: 55% of sales, +8.7%

o SSS of +8%, an acceleration from +4.3% last quarter.

o Generated strong growth in all regions and all customer end markets, led by double digit growth in residential repaint.

o Opened 31 net new stores year to date.

o Professional painting contractor customers continue to report strong demand.

· Consumer Brands Group: 16% of sales, -12%

o The decrease in the quarter was due to softer sales outside of North America, lapping load-in sales for a new customer program in 2018 and the divestiture of the Guardsman furniture protection business.

o In North America, we continued to strengthen our relationships with our largest retail partners.

o FX headwinds(-1.3%)

· Performance Coatings Group: 29% of sales, -0.3%

o Soft sales outside North America and unfavorable currency translation. FX headwinds(-1.6%)

o The segment was impacted by slowing industrial demand in some end markets, leading to slightly lower sales in the quarter.

o Despite the softer than expected top line, with moderating raw material costs margins increased YoY.

o Revenue growth strongest in coil and packaging.

Valuation:

  • Expected free cash flow of ~$2.2B in 2020, trading at >4% FCF yield.
  • Given growth prospects, steady FCF margins and high ROIC the stock is undervalued. They deserve a premium multiple based on large exposure to the N. American paint contractor market and lack of exposure to the cyclical sensitive auto OEM end market.
  • Balance sheet leverage from the Valspar acquisition continues to improve; they expect to get to under 3x by the end of the year.

· Refinanced and extended the maturity of their debt, locking in lower rates.

· Share buybacks should increase in 2020 as they get their leverage ratio down to 2-3x.

Thesis:

  • SHW is the largest supplier of architectural coatings in the US. Sherwin-Williams has the leading market share among professional painters, who value brand, quality, and store proximity far more than their consumer (do-it-yourself) counterparts.
  • Their acquisition of Valspar creates a more diversified product portfolio, greater geographic reach, and is expected to be accretive to margins and EPS. The combined company is a premier global paint and coatings provider.
  • SHW is a high-quality materials company leveraged to the U.S. housing market. Current macro and business factors are supportive of demand:
    • High/growing U.S. home equity values. Home equity supportive of renovations.
    • Improving household formation rates off trough levels (aging millennials).
    • Baby boomers increasingly preferring to hire professionals vs. DIY.
    • Solid job gains and low mortgage rates support homeownership.
    • Residential repainting makes up two thirds of paint volume. Homeowners view repainting as a low-cost, high-return way of increasing the value of their home, especially before putting it on the market.

$SHW.US

[tag SHW]

Sarah Kanwal

Equity Analyst, Director

Direct: 617.226.0022

Fax: 617.523.8118

Crestwood Advisors

One Liberty Square, Suite 500

Boston, MA 02109

www.crestwoodadvisors.com

Crown Castle Earnings Update

Crown Castle reported a good quarter yesterday with a broad beat and strong guidance. CCI beat on both site rental revenue and networks services revenue, and reported better than expected EBITDA and EPS.

Thesis intact, highlights on the quarter:

· The company is experiencing the highest level of tower leasing activity in more than a decade, and management expects this to continue.

· Organic site rental revenue was +6%

· CCI small cell pipeline in 2019 is 10 – 15 thousand nodes (trending now on the lower end around 10k)

· Management provided FY20 guidance for the first time for ~8% AFFO growth and assumes the proposed merger between T-Mobile and Sprint in 1Q20

· Strong 2020 outlook for new leasing activity for towers: +$145 million at the mid-point is $5 million higher than +$140m outlook for 2019.

· Fiber guidance reflects an expectation for improved leasing activity. Initial outlook for new leasing activity in 2020 of $165 million is +$15 million higher than the company’s 2019 outlook for $150 million in fiber solutions.

· CCI’s outlook on fiber and small cells reflects carriers’ deployment of new spectrum and densification of their networks in preparation for 5G

· Big 4 carriers make up 90% of site rental revenue – AT&T, Sprint, T-Mobile and Verizon.

· Could see churn picking up from the TMUS/S merger in 2020. However, management views a T-Mobile/Sprint merger as a long-term positive as Sprint has valuable spectrum holdings which it has not been able to fully deploy due to capital constraints, and T-Mobile appears likely to accelerate deployment of 5G as part of its anticipated integration. Management believes that the investment from a combined T-Mobile/Sprint, with or without DISH as a fourth wireless carrier, will likely more than offset the impacts of T-Mobile decommissioning duplicative sites.

· Dividend increase of 7% delivered on targeted annual range of 7-8%.

Valuation:

· Strong AFFO growth will drive the valuation (2020 expected 8% YoY). They have a 10 year AFFO CAGR of ~14%.

· High incremental margins means AFFO growth should outpace or be in line with site rental revenue growth.

· Low maintenance capex (~2% of revenue) supports high AFFO margins.

· Expected $2.479B in AFFO ($5.94/share) in 2019 is a yield of just under 5%. This is an attractive yield given the secular growth potential.

The Thesis on Crown Castle:

1. CCI is well positioned to capitalize on secular mobile data demand growth and small cell/urban opportunity.

2. Strong competitive position. Leading US tower company.

3. Toll booth business – offensive (secular growth) & defensive (4% dividend & contracted cash flows) characteristics.

4. Revenues derived from long term contracts with price escalators and good visibility.

Sarah Kanwal

Equity Analyst, Director

Direct: 617.226.0022

Fax: 617.523.8118

Crestwood Advisors

One Liberty Square, Suite 500

Boston, MA 02109

www.crestwoodadvisors.com

$CCI.US

[tag CCI]

JNJ 3Q19 earnings summary

Key Takeaways:

Current Price: $133 Price Target: $150

Position size: 2.52% 1-Year Performance: -2.4%

J&J reported sales and earnings ahead of expectations, thanks to better pharma drug sales of +6.4% organic. The Medical Devices segment saw good growth as well (+5.3% organic), while Consumer was the lowest reported (+1.3% organic) due to tough comps y/y and competitive pressure outside the US. On the positive side, the beauty and OTC businesses continue to gain market share in the US. JNJ raised its 2019 sales and EPS guidance after today’s results: organic sales now expected to be +4.5%-5% (from +3.2%-3.7%) and EPS 1% higher. China is still experiencing healthy growth (15% overall): 19% from Medical Devices, 14% in Pharma, 5% in Consumer. Tariffs had no impact on the business.

The company gave a preliminary 2020 outlook: sales growth to reaccelerate thanks to above market growth in Pharma and consistent Medical Devices growth of 3-4%. EPS growth will be somewhat limited by investment in R&D, especially in Medical Devices.

During the call, the management team answered some questions on recent litigation matters. They see the talc litigation as a big business for plaintiffs’ attorney, who spent $400M in TV advertising trying to add new class action suits. This has become a $36B industry, looking for negative headlines to drive more plaintiffs. The management team added that judgments in their favor rarely make the headlines. However, J&J has not seen any negative impacts from the lawsuits on their consumer segment, and will continue to defend its products. Regarding opioids, it seems the company is willing to settle (rather than go to court), as its sees this as the better solution for all stakeholders.

Thesis on JNJ reiterated:

  • High quality company with consistent 20% ROE, attractive FCF yield,
  • Investments in the pipeline and moderating patent expirations create a profile for accelerated revenue and earnings growth
  • Growth opportunity: Medical Devices and Consumer offer sustainable growth and potential for expansion internationally
  • Strong balance sheet that offers opportunities for M&A.

[tag JNJ]

$JNJ.US

Julie S. Praline

Director, Equity Analyst

Direct: 617.226.0025

Fax: 617.523.8118

Crestwood Advisors

One Liberty Square

Suite 500

Boston, MA 02109

www.crestwoodadvisors.com

Constellation Brands (STZ) earnings summary

Key takeaways:

Current Price: $192 Price Target: $226 (NEW)

Position Size: 2.52% 1-Year Performance: +15.5% (since inception 12/20/2018)

Constellation Brands released their 2Q FY20 earnings results this morning. While their beer performance was stellar as usual (+7.5% depletion), it was overshadowed by their cannabis investment. Canopy Growth proves to be more challenging, with close to $500M in losses this quarter, and STZ recognizing a $839M decrease on its equity fair value. This is not totally surprising as STZ ousted Canopy’s founder and CEO Bruce Linton this summer, being “not pleased” with Canopy’s results, announcing this summer that they needed 3-5 year to turn profitable.

The FY20 guidance of 7-9% beer sales and operating income growth was maintained, while its wine sales decline is now better at -15% to -20% (vs. prior -20% to -25%). The divestment of the lower-priced wines is now expected to close at the end of 3Q FY20, explaining why the adjusted sales and EPS guidance was raised slightly to account for a later divestment date than expected. Gross margins expanded 45bps.

We are excited to hear that Constellation is expanding its Corona line with the launch of a Corona Hard Seltzer next year (a high growth drink category). We are updating our price target to $226 to account for the sale of the lower priced wine & spirit brands (lowering FCF $).

Below is a picture of the new product (not yet released by the company – this was found on a blog…)

Investment Thesis:

· Adding STZ helps position our portfolio to be more defensive at this stage of the economic cycle

· STZ is down ~20% YTD, giving us a good entry point

· STZ continues to have HSD top line growth and high margins that should incrementally improve going forward

· STZ comes out of a heavy capex investment cycle to support its growth: FCF margins are set to inflect thanks to lower capex

[tag STZ]

$STZ.US

Julie S. Praline

Director, Equity Analyst

Direct: 617.226.0025

Fax: 617.523.8118

Crestwood Advisors

One Liberty Square

Suite 500

Boston, MA 02109

www.crestwoodadvisors.com

Schwab cuts trading fees to zero

Hi,

Yesterday Schwab announced that they would eliminate commissions on trades for all US stocks and ETFs. The surprise move sent SCHW shares down 10% and sent ripples across other online trading companies. For Schwab trading revenue has been declining for the past decade. They advertise discount trading to grow assets under management (AUM). They have been the leader in reducing costs and pressuring the competitors to follow.

For Schwab trading revenue is only 6-7% of total revenue which is far less than Ameritrade or IBG both whom collect more than a third of their revenue from trading. Clearly, Schwab is placing a lot of pressure on competitors and some consolidation is expected. Yesterday, Ameritrade’s stock fell by over 20%.

Our thesis for buying Schwab focuses on growth in AUM, not trading revenue. Schwab estimates they could lose $400m in revenue through zero commissions which could be replaced by $20b gain in deposits. Schwab has grown deposits by more than $20b annually over the past 3 years. Deposit growth is driven by AUM growth and the amount of cash held by investors. Cash levels are near market cycle lows, so an increase in market volatility (fear) could raise cash levels and benefit Schwab’s bottom line.

Since we bought Schwab, interest rates have fallen significantly. Considering Schwab’s interest revenue is 73% of total revenue, the effect of a decline in interest rates on net margin is important – much more important than trading revenue. We expect some contraction in net interest margin, but also expect Schwab to manage costs by keeping deposit yields low. Schwab’s strategy to gain assets is to give away trading, while Fidelity has been advertising higher yields on money markets funds.

Schwab reports Q3 on 10/15, which will give us greater insight on AUM growth, deposit growth and net interest margin.

Please let me know if you have any questions.

Thanks,

John

$US.SCHW

[tag Equity Research]

John R. Ingram CFA

Chief Investment Officer

Partner

Direct: 617.226.0021

Fax: 617.523.8118

Crestwood Advisors

One Liberty Square

Suite 500

Boston, MA 02109

www.crestwoodadvisors.com

McCormick (MKC) 3Q19 earnings review

Key Takeaways:

Current Price: $167 Price Target: $174 (NEW)

Position size: 2.80% 1-Year Performance: +26%

McCormick released 3Q EPS that beat expectations with sales +2.2% (ex-FX), thanks to positive volume/mix in its Consumer segment: sales were +4%. Consumer operating margins expanded 250bps y/y, leading adjusted consolidated margins higher 160bps y/y. Their Flavor Solutions segment proved once more to be volatile quarter-to-quarter as sales were down 0.4%. The company had a warehouse transition to support its future growth which had a negative impact on sales as well. The management team raised the EPS guidance for the year to $5.30-$5.35 from $5.20-$5.30 but this is mostly driven by lower taxes as sales growth (ex-FX) was narrowed down to 3-4% from 3.5% and operating income from 8-10% to 8-9%. As the reduction in leverage is ahead of schedule, MKC announced being on the hunt for companies to acquire. The company is also expecting to spend more in advertising in the fourth quarter, an important season for the company with the Holidays and home cooking. While the quarter was good, we think the stock is reacting very well today (+7%) as the management team highlighted during the call that the growth in the private label category recently moderated significantly. The competition from private labels has been strong in the past years, so we see this as a good explanation for today’s move back to prior trading levels the stock reached this summer (the stock had been weak after a sell-side analyst downgrade in August). We are updating our price target to $174.

The Thesis on MKC:

• Industry Leader: McCormick & Company (MKC) is a leading manufacturer of spices and flavorings. MKC has been in business for 120 years and the founding family still has ownership interest

• Growth opportunity: Spice consumption is growing 3 times faster than population growth. With the leading branded and private label position, MKC stands to be the biggest beneficiary of this global trend

• Offense/Defense: MKC supplies spices to major food companies including PepsiCo and YUM! Brands giving it a blend of cyclical and counter-cyclical exposure

• Balance sheet and cash flow strength offer opportunities for continued consolidation through M&A in the sector

$US.MKC

[tag MKC]

Julie S. Praline

Director, Equity Analyst

Direct: 617.226.0025

Fax: 617.523.8118

Crestwood Advisors

One Liberty Square

Suite 500

Boston, MA 02109

www.crestwoodadvisors.com

Update on Alphabet

Yesterday 50 attorneys general from 48 states announced an investigation into anti-competitive practices at Google and Facebook – (includes DC and Puerto Rico, but not California and Alabama). The stock is not really reacting to the news. Among the concerns cited by the AG’s were the company raising costs for advertisers and questioning whether consumers are getting the best information from search results. This announcement comes after the DoJ has announced a broad review of Big Tech and is recently confirmed to be conducting an investigation of Alphabet. The FTC is investigating FB and is rumored to have plans to investigate Amazon. Below is a good excerpt from the WSJ outlining the potential case against Google. It’s not clear what the outcome may be. A required change to their business model would likely be more damaging than fines. Alphabet has been investigated by the FTC previously – in 2013 the commission voted unanimously not to bring any charges and determined that Google’s practices improved search results for the benefit of users and that any negative impact on competitors was “incidental to that purpose.” After lengthy investigations in the EU over the last few years Alphabet was fined over $9B (see below). To put that in perspective, Alphabet has over $100B in net cash on their balance sheet and produces $20-$30B in FCF annually.

Recent EU fines:

1. $1.7B in 2019 for illegal practices in search advertising aimed at cementing its dominant market position.

2. $5.1B in 2018 for abusing the market dominance of its Android operating system to extend the reach of Google’s search engine.

3. $2.7B billion in 2017 for abusing its market share to illegally provide an advantage to its own Shopping service.

The Potential Case Against Google

•That Google has used its dominance in online search to solidify its dominance in internet advertising, creating an unfair advantage over publishers and rival tech firms that sell and place ads online. Google, thanks in part to acquisitions of potential rivals such as DoubleClick, has come to dominate software tools at every layer between online advertisers and websites, including the main tech platform that connects buyers and sellers of display ads, this argument goes. That middleman status has given it great power, especially because no one else has anything like the data Google possesses on publishers, advertisers and what consumers search for. Advertisers are boosting their spending on digital ads, but much of the money goes to Google and Facebook, not publishers, whose ad revenues continue to decline. (News Corp, publisher of The Wall Street Journal, is among those raising objections.)

•That Google won or maintained its huge market share of online ad sales by excluding others that could have competed, including through contractual terms that make it harder for advertisers and publishers to work with other ad businesses that want to compete with Google. Advertisers feel they must use Google’s products, rather than tools from other companies, according to this argument. And in 2016, Google began requiring that advertisers use its tools to buy ads on its YouTube channel, which has by far the biggest audience for online videos.

Google’s Defense

•Google has an enviable place in online advertising, but it doesn’t have monopolistic pricing power. Google competes with other big tech companies including Facebook and Amazon for ad dollars, and weak demand for old advertising models—not its role in the ad-tech machinery—is the reason publishers haven’t reaped more of a windfall from digital ads.

•Google’s actions are geared toward goals like giving users the information they want, as quickly as possible. Sometimes that means directing consumers to Google sites and services, the company says. Supreme Court precedent states that companies such as Google generally have no duty to assist in promoting a rival. In a 2004 ruling, the high court threw out antitrust allegations that Verizon Communications Inc. provided insufficient service to rival telecom companies using its phone lines.

•Many of Google’s services are free to the public, with consumers effectively paying with the personal data they generate. Judges may face challenges assessing the nontraditional products that companies like Google and Facebook offer. “It’s not like having 90% of the market for toothpaste,” said Cleveland State University law professor Christopher Sagers.

Sarah Kanwal

Equity Analyst, Director

Direct: 617.226.0022

Fax: 617.523.8118

Crestwood Advisors

One Liberty Square, Suite 500

Boston, MA 02109

www.crestwoodadvisors.com

$GOOGL.US

[tag GOOGL]

Update on Q2 Earnings results…

Summary of Q2 earnings results for the S&P:

· Q2 EPS growth was -0.4% – this is better than the -2.7% expected.

· Revenue growth for Q2 was 4%. This is better than the 3.8% growth expected.

· Margins are down 50bps YoY for the S&P.

· Companies with higher international exposure are seeing lower growth because of strong dollar and weaker macro environment outside the US – see charts below.

· Percent of companies beating on revenue (56%) is well below average.

· % of companies issuing negative EPS guidance for Q3 is above average

· Highest earnings growth: health care and financials

· Biggest decline in earnings: materials and industrials. Within materials Metals & Mining earnings were down -76%. Within industrials Aerospace & Defense earnings were down -50%.

· Highest revenue growth: communication services and health care.

· Biggest revenue decline: materials.

· For CY 2019, analysts are projecting 1.5% earnings growth and 4.4% revenue growth.

· For CY 2020, analysts are projecting 10.7% earnings growth and 5.6% revenue growth.

Sarah Kanwal

Equity Analyst, Director

Direct: 617.226.0022

Fax: 617.523.8118

Crestwood Advisors

One Liberty Square, Suite 500

Boston, MA 02109

www.crestwoodadvisors.com