JNJ 3Q19 earnings summary

Key Takeaways:

Current Price: $133 Price Target: $150

Position size: 2.52% 1-Year Performance: -2.4%

J&J reported sales and earnings ahead of expectations, thanks to better pharma drug sales of +6.4% organic. The Medical Devices segment saw good growth as well (+5.3% organic), while Consumer was the lowest reported (+1.3% organic) due to tough comps y/y and competitive pressure outside the US. On the positive side, the beauty and OTC businesses continue to gain market share in the US. JNJ raised its 2019 sales and EPS guidance after today’s results: organic sales now expected to be +4.5%-5% (from +3.2%-3.7%) and EPS 1% higher. China is still experiencing healthy growth (15% overall): 19% from Medical Devices, 14% in Pharma, 5% in Consumer. Tariffs had no impact on the business.

The company gave a preliminary 2020 outlook: sales growth to reaccelerate thanks to above market growth in Pharma and consistent Medical Devices growth of 3-4%. EPS growth will be somewhat limited by investment in R&D, especially in Medical Devices.

During the call, the management team answered some questions on recent litigation matters. They see the talc litigation as a big business for plaintiffs’ attorney, who spent $400M in TV advertising trying to add new class action suits. This has become a $36B industry, looking for negative headlines to drive more plaintiffs. The management team added that judgments in their favor rarely make the headlines. However, J&J has not seen any negative impacts from the lawsuits on their consumer segment, and will continue to defend its products. Regarding opioids, it seems the company is willing to settle (rather than go to court), as its sees this as the better solution for all stakeholders.

Thesis on JNJ reiterated:

  • High quality company with consistent 20% ROE, attractive FCF yield,
  • Investments in the pipeline and moderating patent expirations create a profile for accelerated revenue and earnings growth
  • Growth opportunity: Medical Devices and Consumer offer sustainable growth and potential for expansion internationally
  • Strong balance sheet that offers opportunities for M&A.

[tag JNJ]

$JNJ.US

Julie S. Praline

Director, Equity Analyst

Direct: 617.226.0025

Fax: 617.523.8118

Crestwood Advisors

One Liberty Square

Suite 500

Boston, MA 02109

www.crestwoodadvisors.com

Constellation Brands (STZ) earnings summary

Key takeaways:

Current Price: $192 Price Target: $226 (NEW)

Position Size: 2.52% 1-Year Performance: +15.5% (since inception 12/20/2018)

Constellation Brands released their 2Q FY20 earnings results this morning. While their beer performance was stellar as usual (+7.5% depletion), it was overshadowed by their cannabis investment. Canopy Growth proves to be more challenging, with close to $500M in losses this quarter, and STZ recognizing a $839M decrease on its equity fair value. This is not totally surprising as STZ ousted Canopy’s founder and CEO Bruce Linton this summer, being “not pleased” with Canopy’s results, announcing this summer that they needed 3-5 year to turn profitable.

The FY20 guidance of 7-9% beer sales and operating income growth was maintained, while its wine sales decline is now better at -15% to -20% (vs. prior -20% to -25%). The divestment of the lower-priced wines is now expected to close at the end of 3Q FY20, explaining why the adjusted sales and EPS guidance was raised slightly to account for a later divestment date than expected. Gross margins expanded 45bps.

We are excited to hear that Constellation is expanding its Corona line with the launch of a Corona Hard Seltzer next year (a high growth drink category). We are updating our price target to $226 to account for the sale of the lower priced wine & spirit brands (lowering FCF $).

Below is a picture of the new product (not yet released by the company – this was found on a blog…)

Investment Thesis:

· Adding STZ helps position our portfolio to be more defensive at this stage of the economic cycle

· STZ is down ~20% YTD, giving us a good entry point

· STZ continues to have HSD top line growth and high margins that should incrementally improve going forward

· STZ comes out of a heavy capex investment cycle to support its growth: FCF margins are set to inflect thanks to lower capex

[tag STZ]

$STZ.US

Julie S. Praline

Director, Equity Analyst

Direct: 617.226.0025

Fax: 617.523.8118

Crestwood Advisors

One Liberty Square

Suite 500

Boston, MA 02109

www.crestwoodadvisors.com

Schwab cuts trading fees to zero

Hi,

Yesterday Schwab announced that they would eliminate commissions on trades for all US stocks and ETFs. The surprise move sent SCHW shares down 10% and sent ripples across other online trading companies. For Schwab trading revenue has been declining for the past decade. They advertise discount trading to grow assets under management (AUM). They have been the leader in reducing costs and pressuring the competitors to follow.

For Schwab trading revenue is only 6-7% of total revenue which is far less than Ameritrade or IBG both whom collect more than a third of their revenue from trading. Clearly, Schwab is placing a lot of pressure on competitors and some consolidation is expected. Yesterday, Ameritrade’s stock fell by over 20%.

Our thesis for buying Schwab focuses on growth in AUM, not trading revenue. Schwab estimates they could lose $400m in revenue through zero commissions which could be replaced by $20b gain in deposits. Schwab has grown deposits by more than $20b annually over the past 3 years. Deposit growth is driven by AUM growth and the amount of cash held by investors. Cash levels are near market cycle lows, so an increase in market volatility (fear) could raise cash levels and benefit Schwab’s bottom line.

Since we bought Schwab, interest rates have fallen significantly. Considering Schwab’s interest revenue is 73% of total revenue, the effect of a decline in interest rates on net margin is important – much more important than trading revenue. We expect some contraction in net interest margin, but also expect Schwab to manage costs by keeping deposit yields low. Schwab’s strategy to gain assets is to give away trading, while Fidelity has been advertising higher yields on money markets funds.

Schwab reports Q3 on 10/15, which will give us greater insight on AUM growth, deposit growth and net interest margin.

Please let me know if you have any questions.

Thanks,

John

$US.SCHW

[tag Equity Research]

John R. Ingram CFA

Chief Investment Officer

Partner

Direct: 617.226.0021

Fax: 617.523.8118

Crestwood Advisors

One Liberty Square

Suite 500

Boston, MA 02109

www.crestwoodadvisors.com

McCormick (MKC) 3Q19 earnings review

Key Takeaways:

Current Price: $167 Price Target: $174 (NEW)

Position size: 2.80% 1-Year Performance: +26%

McCormick released 3Q EPS that beat expectations with sales +2.2% (ex-FX), thanks to positive volume/mix in its Consumer segment: sales were +4%. Consumer operating margins expanded 250bps y/y, leading adjusted consolidated margins higher 160bps y/y. Their Flavor Solutions segment proved once more to be volatile quarter-to-quarter as sales were down 0.4%. The company had a warehouse transition to support its future growth which had a negative impact on sales as well. The management team raised the EPS guidance for the year to $5.30-$5.35 from $5.20-$5.30 but this is mostly driven by lower taxes as sales growth (ex-FX) was narrowed down to 3-4% from 3.5% and operating income from 8-10% to 8-9%. As the reduction in leverage is ahead of schedule, MKC announced being on the hunt for companies to acquire. The company is also expecting to spend more in advertising in the fourth quarter, an important season for the company with the Holidays and home cooking. While the quarter was good, we think the stock is reacting very well today (+7%) as the management team highlighted during the call that the growth in the private label category recently moderated significantly. The competition from private labels has been strong in the past years, so we see this as a good explanation for today’s move back to prior trading levels the stock reached this summer (the stock had been weak after a sell-side analyst downgrade in August). We are updating our price target to $174.

The Thesis on MKC:

• Industry Leader: McCormick & Company (MKC) is a leading manufacturer of spices and flavorings. MKC has been in business for 120 years and the founding family still has ownership interest

• Growth opportunity: Spice consumption is growing 3 times faster than population growth. With the leading branded and private label position, MKC stands to be the biggest beneficiary of this global trend

• Offense/Defense: MKC supplies spices to major food companies including PepsiCo and YUM! Brands giving it a blend of cyclical and counter-cyclical exposure

• Balance sheet and cash flow strength offer opportunities for continued consolidation through M&A in the sector

$US.MKC

[tag MKC]

Julie S. Praline

Director, Equity Analyst

Direct: 617.226.0025

Fax: 617.523.8118

Crestwood Advisors

One Liberty Square

Suite 500

Boston, MA 02109

www.crestwoodadvisors.com

TJX 2Q20 Earnings Update

Current Price: $50 Price Target: $60

Position Size: 3.4% TTM Performance: 1%

TJX initially traded down after reporting revenue that missed quarterly estimates and guiding below consensus for next quarter. Since the call the stock has recovered as management indicated weather in May dampened same store sales (SSS) results which contributed to the miss. SSS in June and July materially improved. Weak SSS at HomeGoods also contributed to the miss, but mgmt. said that was almost entirely self-inflicted and not really about a weakening macro environment. Additionally, management’s commentary around their inventory positioning eased concerns of bloated inventories (inventory growth outpaced sales growth in the quarter). Full year SSS and EPS guidance maintained.

Key takeaways:

· Revenue missed on same store sales of +2% vs expected +3%.

· Traffic was again the biggest driver of SSS. E-commerce sales are not included in SSS numbers.

· EPS was in-line with expectations.

· Management sees Q3 EPS of $0.63-$0.65, below consensus of $0.68, on same-store sales growth of 1%-2%. In Q3 they are lapping their strongest quarter last year which saw a 7% consolidated comp increase and a 9% comp at Marmaxx.

· In Q2, their core Marmaxx division (60% of revenue) delivered SSS growth of +2%.

· Flat SSS at HomeGoods contributed to the miss – management attributed this to issues in a few categories which they are working to fix. This led to higher markdowns and some margin compression in this segment. Mgmt said 80% to 90% self-inflicted execution issues and very, very, very little macro environment.

· International comp sales grew an impressive 6%. Despite the challenging retail landscape in Europe they continue to take share as many other major retailers across Europe report slower sales growth and close underperforming stores.

· Higher payroll costs and escalating freight expenses from rising home-furniture penetration are margin headwinds

· Merchandise margin was down, but would have been positive ex-freight.

· In terms of inventory, mgmt. said they are “thrilled with the tremendous buying opportunities we see in the marketplace, and are in an excellent position to take advantage of them .”

· When asked on the call about the impact of tariffs they said in the “short term, we believe some of the advantageous buys that we’re making more recently could be due to early delivery of tariff category merchandise.”

· Chart below demonstrates TJX’s resistance to e-commerce and economic cycles. Despite the ramp in e-commerce share of retail over the last several years, of the companies listed below TJX is nearly half of aggregate incremental spend. The companies listed below represent ~$200B of the $275B in US apparel retail sales. Additionally, in the ’08 to ’09 period they were one of few retailers that continued to grow and post positive SSS.

Continue reading “TJX 2Q20 Earnings Update”

Medtronic (MDT) 1Q FY20 earnings summary

Key Takeaways:

Current Price: $108 Price Target: NEW $115 (OLD $100)

Position Size: 3.27% TTM Performance: +15.7%

Medtronic released their 1Q FY20 results this morning, with organic revenue growth of 3.5%, a +90bps adjusted operating margin expansion and +7.7% adjusted EPS growth. Growth was broad based across the portfolio despite tough y/y comparisons, and with no issues impacting sales or margins. The next catalyst for the stock is the introduction of its new robot Hugo (general surgery) in the fall, a new insulin pump and a less-invasive heart valve, creating some excitement around new pipeline projects, and helping growth to reach a 4-5% growth in 2H20. We are updating our price target to $115 after updating our model for the new fiscal year and new guidance provided. We were previously worried competition was increasing and would negatively impact free cash flow margins but recent results shows the management team has been able to manage this pressure.

Updated FY20 guidance:

Organic revenue growth +/- 4% (unchanged)

Operating margin increase of 40bps (ex-FX)

EPS increased $0.10 to $5.54-$5.60 (+8-9% growth y/y) – some of the increase in EPS comes from lower interest expenses linked to the recent July debt refinancing

MDT Thesis:

· Stands to benefit from secular trends (1) increased utilization from Obamacare (2) developed populations age

· Strong balance sheet and cash flows. Increased access to non-cash should allow MDT to meaningfully increase their dividend

· 6% normalized Real Cash yield provides solid total return profile over next 2-3 years

· Ownership interest aligned. Management incentivized to maximize shareholder returns – 14% 10yr average ROIC

[tag MDT]

$MDT.US

Julie S. Praline

Director, Equity Analyst

Direct: 617.226.0025

Fax: 617.523.8118

Crestwood Advisors

One Liberty Square

Suite 500

Boston, MA 02109

www.crestwoodadvisors.com

CSCO 4Q19 Update

Current Price: $46 Target Price: $63

Position size: 4.1% TTM Performance: 7%

CSCO reported strong Q4 results, but guided below expectations for next quarter. Revenue growth guided to 0% to +2% vs street +2.6% and Q1 adj. EPS guided to $0.80c to $0.82 vs street $0.83. Weaker than expected guidance driven by Server Provider end markets (e.g. telecoms) and China. While China is only about 3% of sales, revenue was down 25% in Q4 and is down “very dramatically” in Q1 which mgmt attributed to the trade war and said that with state-owned enterprises in China they are being uninvited to bid. Their Service Provider end markets have been weak for some time, but should improve over time as telecoms spend to build out the core of their networks for 5G. Management’s tone about the macro environment was more negative…” we did see in July some slight early indications of some macro shifts that we didn’t see in the prior quarter.”

Thesis intact, key takeaways:

· Total revenue was $13.4 billion, up 6%. Non-GAAP EPS was $0.83, up 19%. Q4 gross margin was 65.5%, up 2.3 points.

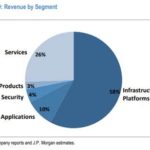
· Infrastructure platforms (largest segment, ~58% of revs) grew 6%. All of the businesses were up with the exception of routing. Switching had a great quarter with double-digit growth with the continued ramp of Cat 9K and strength of the Nexus 9K. Routing declined due to weakness in service provider end markets.

· Applications were up 11% with collaboration, AppDynamics and IoT software all up double digits.

· Security was up 14% with strong performance in identity and access, advanced threat, unified threat and web security.

· Service revenue was up 4% driven by software and solution support.

· They continue to transform their business, delivering more software offerings and driving more subscriptions. Subscription revenue was 70% of total software revenue, up 12pts YoY and 5 points sequentially. This transition will drive an upward trend in CSCO’s margins over the next several years.

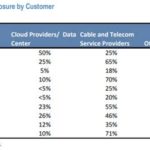
· While orders were flat YoY, orders outside of service provider grew mid-single digits. Total product orders growth was flat. By geography, Americas was up 1%,EMEA was up 4% and APJC was down 8%. Total emerging markets were down 8% with the BRICS plus Mexico down 20%. By customer segments, enterprise was down 2%, commercial grew 7%, public sector was up 13% and service provider was down 21%.

· Cisco is helping their customers change their technology infrastructure to accommodate new technologies like cloud, AI, IoT, 5G and WiFi 6. Their evolving portfolio of products help customers navigate this complexity by helping them simplify, automate, and secure their infrastructure. They are in the early innings of evolving network architectures.

Valuation:

· They have a 3% dividend yield which is easily covered by their FCF.

· In their Q2 fiscal ’18 earnings call, they said they would return $31 billion through share repurchases over the following 18 to 24 months. As of Q4 fiscal ’19 they completed that commitment with share repurchases of 32.6 billion. Going forward, they will return to a capital allocation strategy of returning a minimum of 50% of their FCF to shareholders annually through share repurchases and dividends. This indicates much less buyback going forward as their annual dividend is $6B and half of annual FCF would be less than $8B.

· They have ~$9B in net cash. In the quarter they returned $6B to shareholders – $1.5B in dividends and $4.5B in buybacks.

· Forward FCF yield is ~7.5%, well above sector average and is supported by an increasingly stable recurring revenue business model and rising FCF margins.

· The company trades on a hardware multiple, but the multiple should expand as they keep evolving to a software, recurring revenue model. Hardware trades on a lower multiple because it is lower margin, more cyclical and more capital intensive.

Thesis on Cisco:

· Industry leader in strong secular growth markets: video usage, virtualization and internet traffic.

· Cisco is the leader in enterprise switching and service provider routing and one of the few vendors that can offer end-to-end networking solutions.

· Significant net cash position and strong cash generation provide substantial resources for CSCO to develop and/or acquire new technology in high-growth markets and also return capital to shareholders.

· Cisco has taken significant steps to restructure the business which has helped reaccelerate growth and stabilize margins.

$CSCO.US

[tag CSCO]

Sarah Kanwal

Equity Analyst, Director

Direct: 617.226.0022

Fax: 617.523.8118

Crestwood Advisors

One Liberty Square, Suite 500

Boston, MA 02109

www.crestwoodadvisors.com

PLEASE NOTE!

We moved! Please note our new location above!

Cisco down after hours on weak guidance

Cisco reported Q4 results that beat expectations, but guidance for their fiscal Q1 is below estimates. Revenue growth guided to 0% to +2% vs street +2.6% and Q1 adj. EPS guided to $0.80c to $0.82 vs street $0.83. More details to come.

Sarah Kanwal

Equity Analyst, Director

Direct: 617.226.0022

Fax: 617.523.8118

Crestwood Advisors

One Liberty Square, Suite 500

Boston, MA 02109

www.crestwoodadvisors.com

$CSCO.US

[tag CSCO]