Cost of production of renewable electricity falls below that of coal

Good news for environmental fans!  The economics of renewable power generation are more attractive than those for burning coal even without considering externalities – the cost of pollution and CO2.  In 2017, Coal was used for 29% of energy production, so lots of room to build out renewables.

Expect utilities to struggle with assets of that burn coal as they become less competitive.

FT article on generation costs of renewables less than coal 110918

Thanks,

John

Problems with the Recycling Industry

Passing on one article and one podcast on interesting changes in the recycling industry.  Changes began when China stopped importing recycled goods and energy prices fell.  Recycling is no longer a profitable business and countries need to reassess waste disposal systems and environmental costs of trash.

Planet Money Podcast on Recycling

Why the world’s recycling system stopped working _ Financial Times

When it comes to our personal behavior as to wanting to be ‘green’, reducing waste may become more important than recycling.

Thanks,

John


Stocks erase gains for 2018

Stock markets have continued to fall, erasing YTD gains. As with our 10/11/18 client blast (part of which is pasted below), there is no one overriding source of concern driving the selling. Highlighting this randomness is Marketwatch who offers a list of no fewer than 20 potential market ailments – click here. We believe that rising rates, trade negotiations and slowing global growth top the concerns, but see no need to stoke fear trying to capture every imaginable concern. Certainly, as the Federal Reserve withdrawals liquidity from the economy volatility has increased to more historical levels. As discussed in our last note, the US economy is still on solid footing and we remain committed to investing for the long term.

Perhaps a few reminders on Crestwood’s portfolio construction will help clients. We have built our portfolios considering the effects of both market downturns and upturns:

· Crestwood equities focus on quality stocks (or funds owning high quality stocks) with high returns on invested capital which we expect to outperform through a market cycle. This statement does not mean that every time stocks go down we outperform. In fact, the Focus Equity list has underperformed this week. However, we do expect our stock selection process to add value over time on the downside.

· Our fixed income portfolio focuses on quality bonds, which tend to perform well when stocks fall. In the beginning of last year, we reduced floating rate notes due to their exposure to credit risks.

· We own alternatives investments which diversify the portfolio and serve to reduce risk. Obviously, AQR has notably underperformed this quarter, but REITs have outperformed (QTD down -3.0% versus S&P 500 down -7.2%). We believe that the alternatives through a market cycle will provide added diversification, enhancing returns, should stocks lag.

If clients are nervous about the current quarter of earning releases, here are some points from the end of last week showing how strong results have been:

· Earnings Growth: For Q3 2018, the blended earnings growth rate for the S&P 500 is 19.5%. If 19.5% is the actual growth rate for the quarter, it will tie the mark for the third highest earnings growth since Q1 2011 (also 19.5%).

· Earnings Scorecard: For Q3 2018 (with 17% of the companies in the S&P 500 reporting actual results for the quarter), 80% of S&P 500 companies have reported a positive EPS surprise and 64% have reported a positive sales surprise.

· Valuation: The forward 12-month P/E ratio for the S&P 500 is 15.9. This P/E ratio is below the 5-year average (16.3) but above the 10-year average (14.5).

Hopefully these points help your communications with clients.

Thanks,

John

Client blast from 10/11/18:

We can’t predict the markets or investor behavior, but fundamentals remain sound. Importantly, the U.S. economy remains on a healthy growth track. A driving force in the current jump in GDP growth has been the tax cut stimulus which is expected to continue until the middle of next year. Valuations are modestly elevated but have improved meaningfully this year with earnings growth averaging over 20%. The Federal Reserve continues to gradually increase short-term interest rates. With Federal Funds at 2.00%-2.25%, the Federal Reserve have moved monetary policy from ‘accommodative’ to ‘neutral’, but remains far from restricting economic growth. Inflation throughout this recovery has been stubbornly low with the latest CPI of only 2.3%. There is little need for the Federal Reserve to hike rates aggressively, and the Federal Reserve has been very clear in their intent to move cautiously. We view these rate increases as a return to normal rather than a threat to growth.

Volatility is normal. Each year the markets have some decline that averages 13.8%. Below is a chart that indicates largest drawdowns relative to total returns on an annual basis (click to enlarge):

70dcb562-90b0-41e2-a756-4071b041dd52.png

It is paramount for all of us – investors, managers and clients – to remember to stick to our long term investing goals. Market dislocations like the past two days are common and may become more frequent as market volatility increases back toward normal historical levels. The worst response is to sell stocks after they have fallen, turning a temporary loss into a permanent one. Your asset allocation is based on your long-term goals and the ability to handle market volatility. Keeping a focus on those goals and constraints is far more important than daily changes in stock market prices.

John R. Ingram CFA

Managing Director

Asset Allocation and Research

Direct: 617.226.0021

Fax: 617.523.8118

Crestwood Advisors

One Liberty Square

Suite 500

Boston, MA 02109

www.crestwoodadvisors.com

Test posting please ignore!

As a reminder, a key function of the PBM is to leverage scale and competition to reduce drug costs for clients. PBM keep up to 10% of the “saving”, although CVS mentioned being closer to 5%. Per Goldman Sachs, the rebates business represents a mid-single digit % of its EBITDA. Below is Goldman’s calculation:


cid:<a href=image001.png@01D41F46.8B1A85D0“>

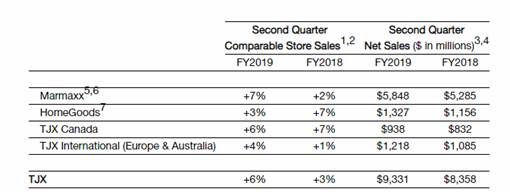
·         Full year EPS and SSS guidance raised. Full year EPS guidance is $4.12 at the midpoint vs $4.07 previously (excluding benefit from a lower tax rate).

·         SSS now expected to be +3-4% vs +1-2% previously (in their 40+ yr. history they’ve had only 1 year of negative SSS).

·         They again made a point about their ability to attract a younger customer to validate the sustainability of their business model. “We are particularly pleased that we have been attracting a significant share of millennial and Gen Z shoppers among our new customers”…”the majority of new customers at Marmaxx, are these younger customers which indeed bodes very well for our future.” There were several minutes of discussion around this, so they must be getting a lot of questions from investors.

·         Merchandise margin was down, but would have been up significantly excluding freight costs – i.e. they are not “buying” this better growth with deeper discounts. Inventory grew in line with sales, a positive indicator for future merchandise margins.


[more]


QUARTER ENDED PAYMENT VOLUME (billions)


QUARTER ENDED TRANSACTIONS (millions)

Valuation:

·         FCF for the quarter was $3.5B and YTD is $8.7B. Trading at a 4% FCF yield.

·         They’ve returned most of their YTD FCF to shareholders through dividends ($1.5B) and buybacks ($5.55B). They have $5.8 billion remaining for share repurchase.

·         For revenue beats: REITs, Industrials and utilities have had the highest % surprise.

·         According to FactSet, the market is rewarding upside earnings surprises less than average and punishing downside earnings surprises more than average.

·         For all of 2018, analysts are projecting earnings growth of 19.5% and revenue growth of 7.2%.

·         Forward P/E Ratio is 16x – it was 16.4x at the beginning of the year. The 5-year average is 16.1x and the 10-Year average is 14.3x.

·          

·         [more]

·        

·          

·         increased household formation. Rising prices tend to increase remodeling activity and spur new housing starts both of which benefit SHW.  Historically, architectural paints is a good leading indicator of industrial paint demand, which means the overall LT demand picture for SHW looks robust. In addition to this, their margins will improve as they increasingly pass on rising input costs and they realize synergies from the Valspar acquisition.

·          

·        


John R. Ingram CFA

Managing Director

Asset Allocation and Research


Direct: 617.226.0021

Fax: 617.523.8118


Crestwood Advisors

One Liberty Square

Suite 500

Boston, MA 02109

www.crestwoodadvisors.com


A quick note on Emerging Markets

Hi,

Emerging markets are in a bear market. Since their peak on 1/26/18, emerging market index is down 20% in price.

EM have faced several headwinds:

· Reduced global liquidity / Rising US rates / Rising US Dollar

· Trade tariffs

· Higher energy prices

Attached is a good FT article providing some perspective.

We have been underweight EM stocks with ~4% in growth portfolios. Does this drop present a buying opportunity???

As the attached article argues, the opportunity depends on the severity of China’s current slowdown as China has been slowing credit growth. Historically, differenciating financial crisis into short-lived ones versus long-lived ones depends on debt. If debt needs to be restructred or forgiven, the recovery period is a long one as the costs of the debt needs to be allocated. We are closely watching to see if economic growth continues to slows in China or if China has to restructure their debts. China is a highly indebted nation with over 300% debt to GDP. Recently, China has slowed credit growth in their shadow banking network, which has been painful. There have been many news articles of investment companies going bankrupt and investors losing all of their investment. China has had periods of credit tightening in the past which have been followed by periods of stimulus. Signs indicate that we are still in the tightening phase.

Thanks,

John

John R. Ingram CFA

Managing Director

Asset Allocation and Research

Direct: 617.226.0021

Fax: 617.523.8118

Crestwood Advisors

One Liberty Square

Suite 500

Boston, MA 02109

www.crestwoodadvisors.com

Shaky emerging markets watch the US and China _ Financial Times.pdf